Machine Learning: Predicting house prices
Recently I have followed an online course on machine learning to understand the current hype better. As with any subject though, only practice makes perfect, so i was looking to apply this new knowledge.
While looking to sell my house I found that would be a nice opportunity: Check if the prices a real estate agents estimates are in line with what the data suggests.
Linear regression algorithm should be a nice algorithm here, this algorithm will try to find the best linear prediction (y = a + bx1 + cx2 ; y = prediction, x1,x2 = variables). So, for example, this algorithm can estimate a price per square meter floor space or price per square meter of garden. For a more detailed explanation, check out the wikipedia page.
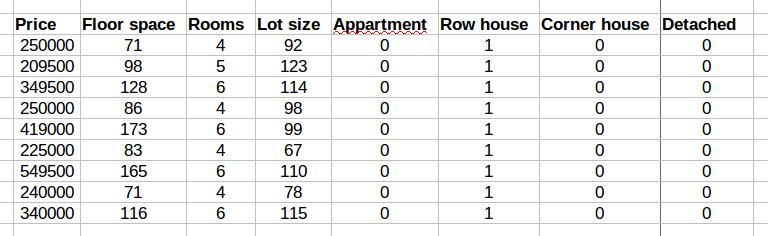
In the Netherlands funda is the main website for selling your house, so I have started by collecting some data, I used data on the 50 houses closest to my house. I’ve excluded apartments to try and limit data to properties similar to my house. For each house I collected the advertised price, usable floor space, lot size, number of (bed)rooms, type of house (row-house, corner-house, or detached) and year of construction (..-1930, 1931-1940, 1941-1950, 1950-1960, etc). These are the (easily available) variables I expected would influence house price the most. Type of house is a categorical variable, to use that in regression I modelled them as several binary (0/1) variables.
As preparation, I checked for relations between the variables using correlation. This showed me that much of the collected data does not seem to affect price: Only the floor space, lot size and number of rooms showed a significant correlation with house price.
For the regression analysis, I only used the variables that had a significant correlation. Variables without correlation would not produce meaningful results anyway.
I’m using python with the sklearn library to apply the linear regression model to my data:
import pandas, sklearn

data = pandas.read_csv('houses.csv')

model = sklearn.linear_model.LinearRegression()

regr.fit(data.as_matrix(['FloorSpace']), data.as_matrix(['Price']))

print 'Price of a 90 sq meter house %f' % model.predict([[90]])[0][0]
With the sklearn library you can also compute cross validation scores. This tells you how well your model approximates the data; can help you decide between different models; or can also help to chose which variables to use for your prediction model. The code below trains and evaluates the model 10 times with a 90/10 split of the data and prints the average error.
import pandas, sklearn

data = pandas.read_csv('houses.csv')

validation_scores = cross_val_score(sklearn.linear_model.LinearRegression(),

data.as_matrix(['FloorSpace', 'Rooms', 'LotSize']),

data.as_matrix(['Price']),

cv=10,

scoring='neg_mean_squared_error')
print “Average error: %f” % math.sqrt(- np.mean(validation_scores))
With my data, a model trained using floor space, rooms and lot size approximated the data the best. The total error in the validation sets (10% of 50 = 5 houses) was around 45,000 euros.
For comparison, estimates from two real real estate agents were around 15,000 euros apart, both estimated higher than my models predicted. This is probably intentional though, to get my business..
There is different models (algorithms) that can be used to predict prices. The sklearn library offers many. Each algorithm can have a different performance on a given problem. To choose between different models we can compare their cross validation scores and pick the best performing one.
import pandas, sklearn

data = pandas.read_csv('houses.csv')
models = {
‘linear_regression’: linear_model.LinearRegression(),
‘elastic_net’: linear_model.ElasticNet(),
‘svr’: svm.SVR(kernel=’linear’),
‘random_forest’: ensemble.RandomForestRegressor()
}
for name, model in models.items():
validation_scores = cross_val_score(model,
data.as_matrix([‘FloorSpace’, ‘Rooms’, ‘LotSize’]),
data.as_matrix([‘Price’]),
cv=10,
scoring=’neg_mean_squared_error’)
print “Model %s had average error: %f” %
(name, math.sqrt(- np.mean(validation_scores))
See below for a chart comparing the errors per algorithm:
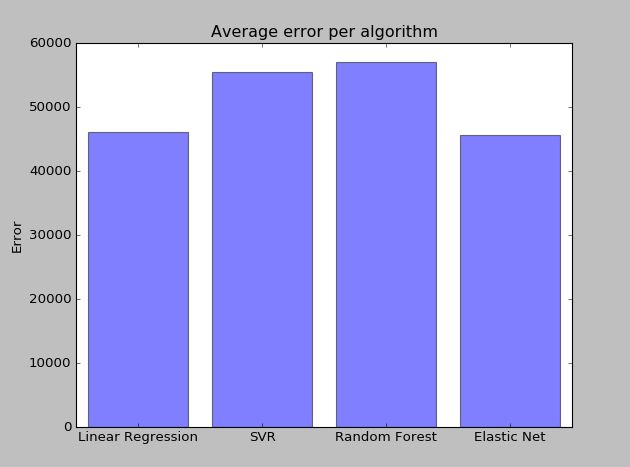
In this case, the ElasticNet model (linear regression with regularization) had the best score, closely followed by plain linear regression.
I hope you enjoyed this exercise or can apply some of the ideas to your own problems. If you have suggestions, feedback or questions, let me know!