Creating an advanced Kibana dashboard using a script

Some time ago, Kibana joined the elasticsearch family. A lot of good things have come out of it. These days Kibana is becoming more advanced. But with more users also come more demands. One of those demands is more advanced dashboards than can be clicked together in the very nice GUI. We want to be able to customize dashboards, prepare dashboards to be used by others.
In this blogpost I am going to show you some of the options you have to create a more advanced dashboard. I use an index I have created based on my iTunes library. We are going to create a dashboard showing information about artists, albums and we show how to use parameters through the url.
Quick intro if you don’t know kibana
Kibana is a tool developed to create nice graphs based on logs send to elasticsearch by logstash. It makes use of the excellent facetted queries as provided by elasticsearch to create tables, histograms, pie charts and even maps with geo points. Kibana is a purely javascript based, so client side, application connecting to the rest interface of elasticsearch. Using the interface you can create lots of different charts presenting data coming out of elasticsearch. the charts are constructed using the forms provided by Kibana.
The structure of a dashboard can also be saved in elasticsearch. You can share your dashboards by url, but we need more. We want to prepare dashboards to be used by others. Preventing them from destroying the dashboard or doing queries that are to heavy on our cluster. Another thing we might want is to change the dashboard based on some specific parameters. The solution is to use dashboard templates or scripted dashboards.
How does it work?
A Kibana dashboard is just a json document. You can store these documents in elasticsearch to keep them for later. In this blog we want to take another approach. There are two other mechanisms to prepare dashboards. One of them is to create a template. This is a json document based on a specific schema. The document you need to create is stored in the kibana directory:
[kibana_home]/app/dashboards
Save a template as a .json document. Each json document that is a dashboard needs to conform to the schema as discussed in the next section.
The schema
Each dashboard can consist of the following items:
Services – Can be reused between the different panels. At the moment these can be filters and queries. These can be found in the kibana interface at the top of the screen.
Row – The object that contains all our rows with panels. This is the object were we add the panels to our screen.
Panel – Kibana comes with a number of different panels that can all be added to your dashboard. Examples are table, histogram, terms, text, map and the even better map.
Index – Configure some index specific properties like the default index and the index pattern.
Other items that I am not going to discuss are: Pulldowns, nav, loader. Check the references for more information about the schema and it’s options.
Exporting existing dashboards as a template
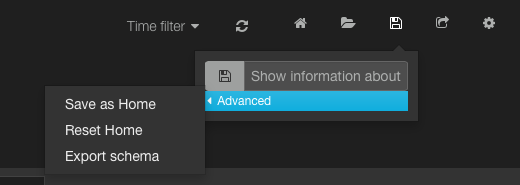
If you are the kind of person (like me) that does not want to start from scratch you can copy one of the examples in the kibana folder. Especially the logstash.json sample is a good start to see what is possible. Another way to start from an existing dashboard is to export a dashboard that you have created using the interface. On the top right menu you can find the disk representing save. Click it and go to the advanced part and chose Export schema. Than you get a json document that you can use as the basis for your template. I personally use this to get a good start for panels I want to add to my dashboard.
In the next section you’ll find out how to look at these dashboards that you store within the kibana website.
Look at an example for logstash
Nice to have these cool templates in Kibana, but how do we acces these new dashboards. This is not very hard, you just need to know two things:
-
- For a template you end the url with: #/dashboard/file/ and the file name of the dashboard. In my case I access the logstash sample dashboard template with the following url.
http://localhost/kibana/#/dashboard/file/logstash.json
-
- When creating a script, like in the next section, the url is different. Instead of file we use script and instead of the extension json, we use js.
http://localhost/kibana/#/dashboard/script/logstash.js
The example dashboard
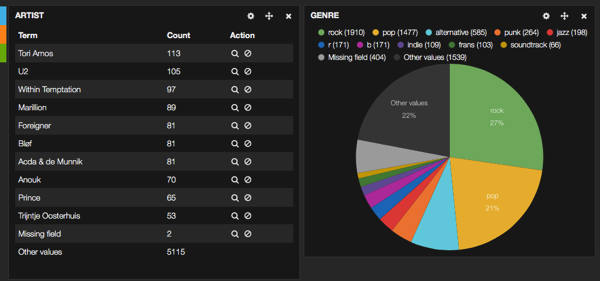
I mentioned in the introduction that I am using an index with my music as a sample index. The index contain all songs as documents. So presenting all songs from an albums means an aggregation over the album field. We can also find all albums for certain artist. In the sample dashboard we show a panel with the artists with the most songs. Next to that a panel with the songs decided by genre in a pie chart. Can you spot an error in my index using the pie chart? Write a comment if you think you know what I mean. Of course when clicking on a genre, a filter is added and the table with artists is changed. At the bottom we have a table with all the songs.
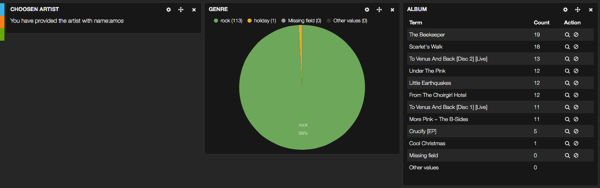
That is all nice, but this is easy to do with the user interface. Now we want to provided the option to pass the name of an artist or a genre to the dashboard. Than we do not need the specific panel, so we replace it with some text. Now we also add a third panel to the top row showing the top songs that belong to the chosen genre or artist. Before showing the results, let us dive into some code.
The first part is some initialization of the dashboard. Most of the comments are coming from the logstash sample as provided by elasticsearch. We set the index to be mymusic and the query to the match all query.
<br>
'use strict';</p>
<p>var dashboard, queries</p>
<p>// All url parameters are available via the ARGS object<br>
var ARGS;</p>
<p>// Intialize a skeleton with nothing but a rows array and service object<br>
dashboard = {<br>
rows : [],<br>
services : {}<br>
};</p>
<p>dashboard.title = 'Show information about my music';<br>
dashboard.failover = false;<br>
dashboard.index = {<br>
default: 'mymusic',<br>
interval: 'none'<br>
};</p>
<p>queries = {<br>
0: {<br>
query: '*',<br>
id: 0,<br>
}<br>
};</p>
<p>// Now populate the query service with our objects<br>
dashboard.services.query = {<br>
list : queries,<br>
ids : _.map(_.keys(queries),function(v){return parseInt(v,10);})<br>
};<br>
The last few lines might be a bit tricky. But all queries are added using an id. We also need to add an array with the same ids.
Next step is to extract some parameters from the url.
Parameters that we provide
You can provide the following parameters:
-
- genre – Name of the genre to filter by.
- artist – name of the artist to filter by.
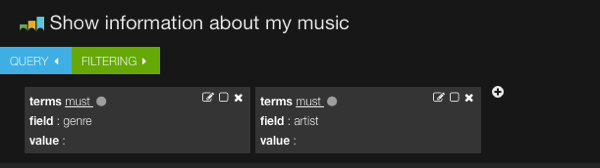
Using these parameters we decide whether to add and enable predefined filters as services.
<br>
dashboard.services.filter = {<br>
list: {<br>
0:{<br>
"type": "terms",<br>
"field": "genre",<br>
"value": ARGS.genre,<br>
"mandate": "must",<br>
"active": !_.isUndefined(ARGS.genre),<br>
"alias": "",<br>
"id": 0<br>
},<br>
1:{<br>
"type": "terms",<br>
"field": "artist",<br>
"value": ARGS.artist,<br>
"mandate": "must",<br>
"active": !_.isUndefined(ARGS.artist),<br>
"alias": "",<br>
"id": 1<br>
}</p>
<p>},<br>
ids: [0,1]<br>
};<br>
As you can see, we add 2 terms filters and enable them if the parameters ARGS.genre and ARGS.artist are available. ARGS is a special object to acces parameters or arguments passed using the url.
The next step is to add some rows and panels to the dashboard.
Add some rows and panels
We have two rows in our dashboard. The second row is just a table with some predefined columns. All properties should explain themselves.
<br>
dashboard.rows[1].panels = [<br>
{<br>
"error": false,<br>
"span": 12,<br>
"editable": true,<br>
"type": "table",<br>
"loadingEditor": false,<br>
"size": 100,<br>
"pages": 5,<br>
"offset": 0,<br>
"sort": [<br>
"album.raw",<br>
"asc"<br>
],<br>
"overflow": "min-height",<br>
"fields": [<br>
"artist",<br>
"album",<br>
"name",<br>
"genre"<br>
],<br>
"highlight": [],<br>
"sortable": true,<br>
"header": true,<br>
"paging": true,<br>
"field_list": false,<br>
"all_fields": false,<br>
"trimFactor": 300,<br>
"localTime": false,<br>
"timeField": "@timestamp",<br>
"spyable": false,<br>
"queries": {<br>
"mode": "all",<br>
"ids": [<br>
0<br>
]<br>
},<br>
"style": {<br>
"font-size": "9pt"<br>
},<br>
"normTimes": true,<br>
"title": "the songs"<br>
}<br>
];<br>
Now we zoom in on the first row. This row is more complicated. It had 3 panels. But the first two panels can change from a terms panel to a text panel if the artist or the genre is provided in the url. Next to that if you provide the artist, we add a third panel with a terms panel containing the albums. The following code block shows added the panels to a row.
<br>
dashboard.rows[0].panels = [<br>
];</p>
<p>if(_.isUndefined(ARGS.artist)) {<br>
dashboard.rows[0].panels.push({<br>
title: 'Artist',<br>
type: 'terms',<br>
field: "artist.raw",<br>
chart: 'table',<br>
span: 4,<br>
spyable: false<br>
});<br>
} else {<br>
dashboard.rows[0].panels.push({<br>
title: 'Choosen artist',<br>
type: 'text',<br>
mode: 'markdown',<br>
content: 'You have provided the artist with name:*'+ARGS.artist+'*',<br>
span: 4<br>
});<br>
}</p>
<p>if(_.isUndefined(ARGS.genre)) {<br>
dashboard.rows[0].panels.push({<br>
title: 'Genre',<br>
type: 'terms',<br>
field: "genre",<br>
chart: 'pie',<br>
span: 4,<br>
spyable: false<br>
});<br>
} else {<br>
dashboard.rows[0].panels.push({<br>
title: 'Choosen genre',<br>
type: 'text',<br>
mode: 'markdown',<br>
content: 'You have provided the genre:*'+ARGS.genre+'*',<br>
span: 4<br>
});<br>
}</p>
<p>if (!_.isUndefined(ARGS.artist)) {<br>
dashboard.rows[0].panels.push({<br>
title: 'Album',<br>
type: 'terms',<br>
field: "album.raw",<br>
chart: 'table',<br>
span: 4,<br>
spyable: false<br>
});<br>
}<br>
Check how we use the arguments provided by ARGS. Adding a panel means adding an object to the dashboard.rows[0].panels array. The final thing I want to mention is the usage of markdown for the text panels.
Look at our result
First the top row without adding parameters.
http://localhost/kibana/#/dashboard/script/mymusic.js
Next the dashboard when providing a parameter for artist
http://localhost/kibana/#/dashboard/script/mymusic.js?artist=amos
References