ANWB Big data Proof of Concept
At the ANWB people are constantly trying to improve the services they provide. One of these services is to provide traffic information. In the Netherlands the National Data Warehouse for Traffic Information (NDW) provides an enormous database of both real-time and historic traffic data.
This data comes from many different sources and is available as open data. Wouldn’t it be great if the ANWB could use this open data to provide more accurate traffic information, either in real-time or as a prediction for a certain period? In a proof of concept we have collected and analysed the real-time traffic information to calculate the traffic intensity on the roads using elasticsearch. We also used weather information to see if the weather has influence on the need of roadside assistance.
Data
The data is available as XML files on a FTP server and is refreshed every minute. We are processing two files, one with measurements and one with traffic speed information. The file with measurements contains 25494 records and the file with traffic speed information contains 15767 records. The traffic speed records are combined with the measurements. So this means that we index 25494 documents every minute.
Because the data consists a lot of different measure points (like cameras or lasers) we only used the measure points that are bedded in the tarmac. A road can be divided in multiple lanes and each of those lanes can have a measure point. This image displays the different measure points that are available.
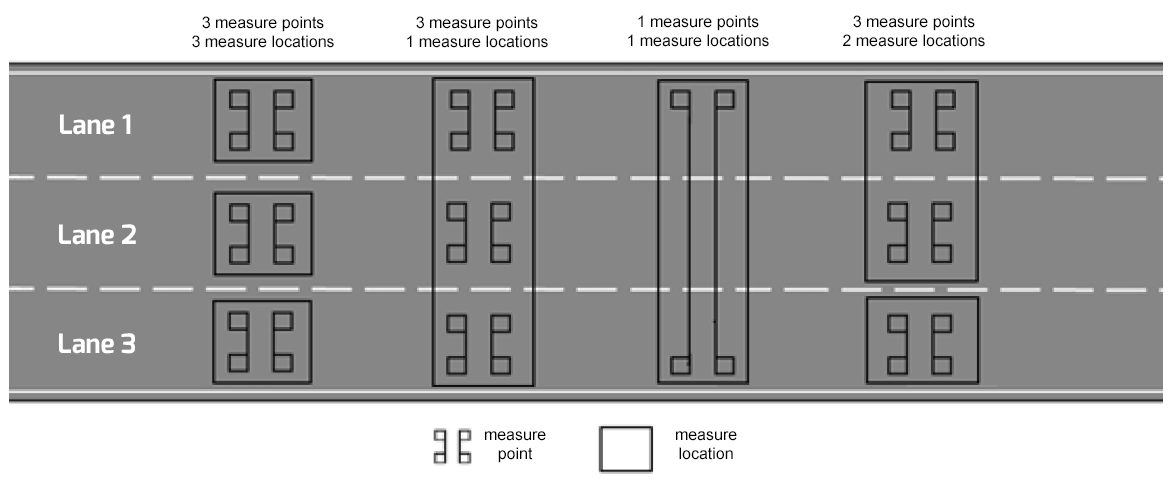
Each measure point contains a lot of information such as the location, type of vehicle that passed, type of carriage way, direction but also how many vehicles passed that point. In our proof of concept we have used the measured speed and vehicle flow rate for a specific location or route to display the data for a given period. If a road contains a measure location with multiple measure points on different lanes, we summed the values of all lanes to keep the data a little bit simple.
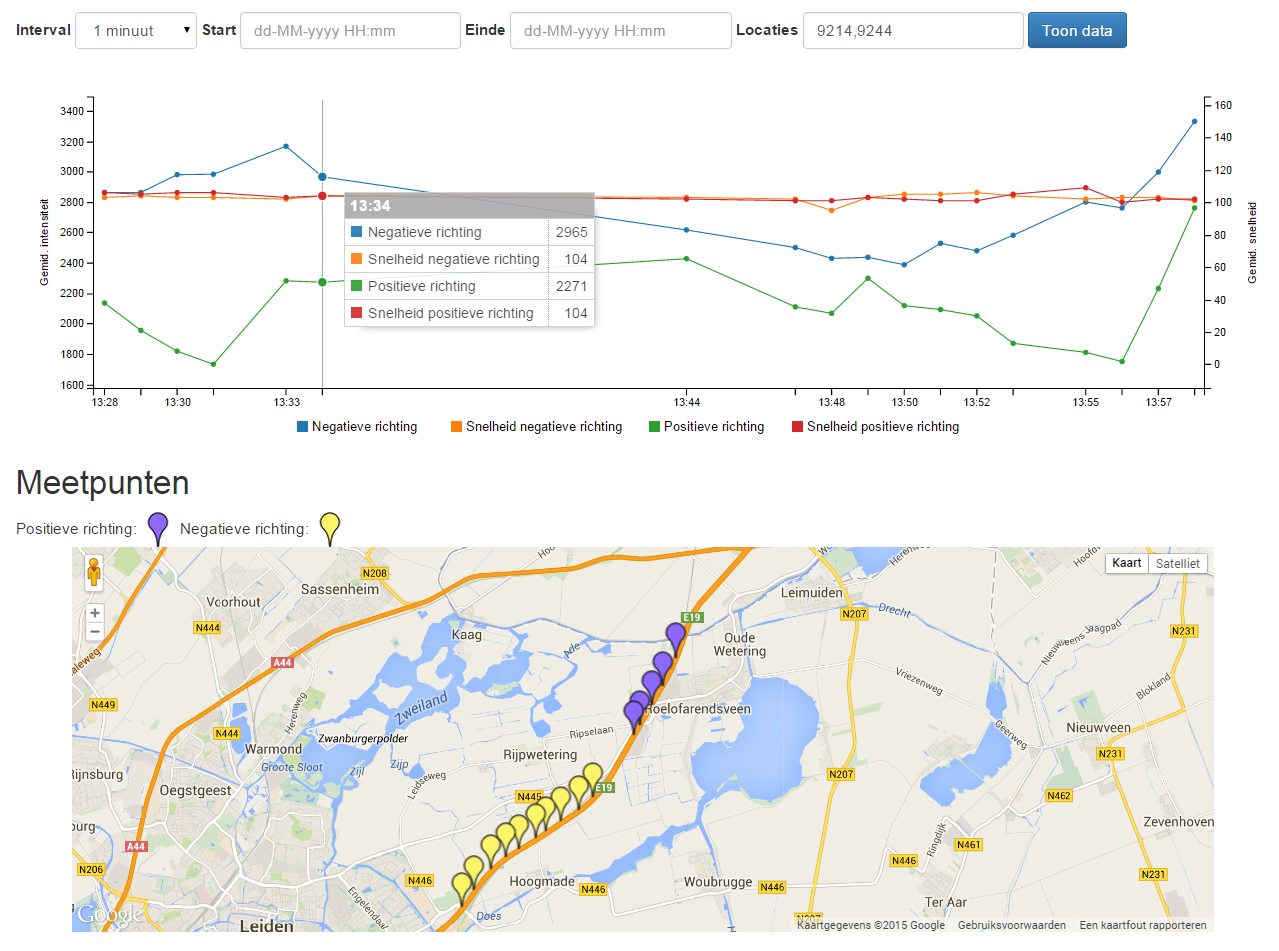
In the image above you see a graph that displays two road directions (blue and green lines) and their corresponding traffic speed (orange and red lines). On the map you can see all the measure points that have been used to calculate the data. With this data you could possibly get a real-time overview of routes where the traffic speed becomes less and the number of cars passing a measure point will decrease. These locations could be an indication that something is happening and could be the start of a traffic jam.
Making better predictions for roadside assistance
The number of cars that need to be available for roadside assistance are predicted each year based on historic information. On a regular base the ANWB checks if the predictions needs to be adapted by checking a number of different possible causes that could increase the traffic like events or sudden weather changes. To make this forecast even better we have added the daily temperature (which is also available as open data provided by KNMI). With the temperature and maybe the precipitation in the future they might be able to see if there is a correlation between the numbers of assistance cars that were needed and the weather.
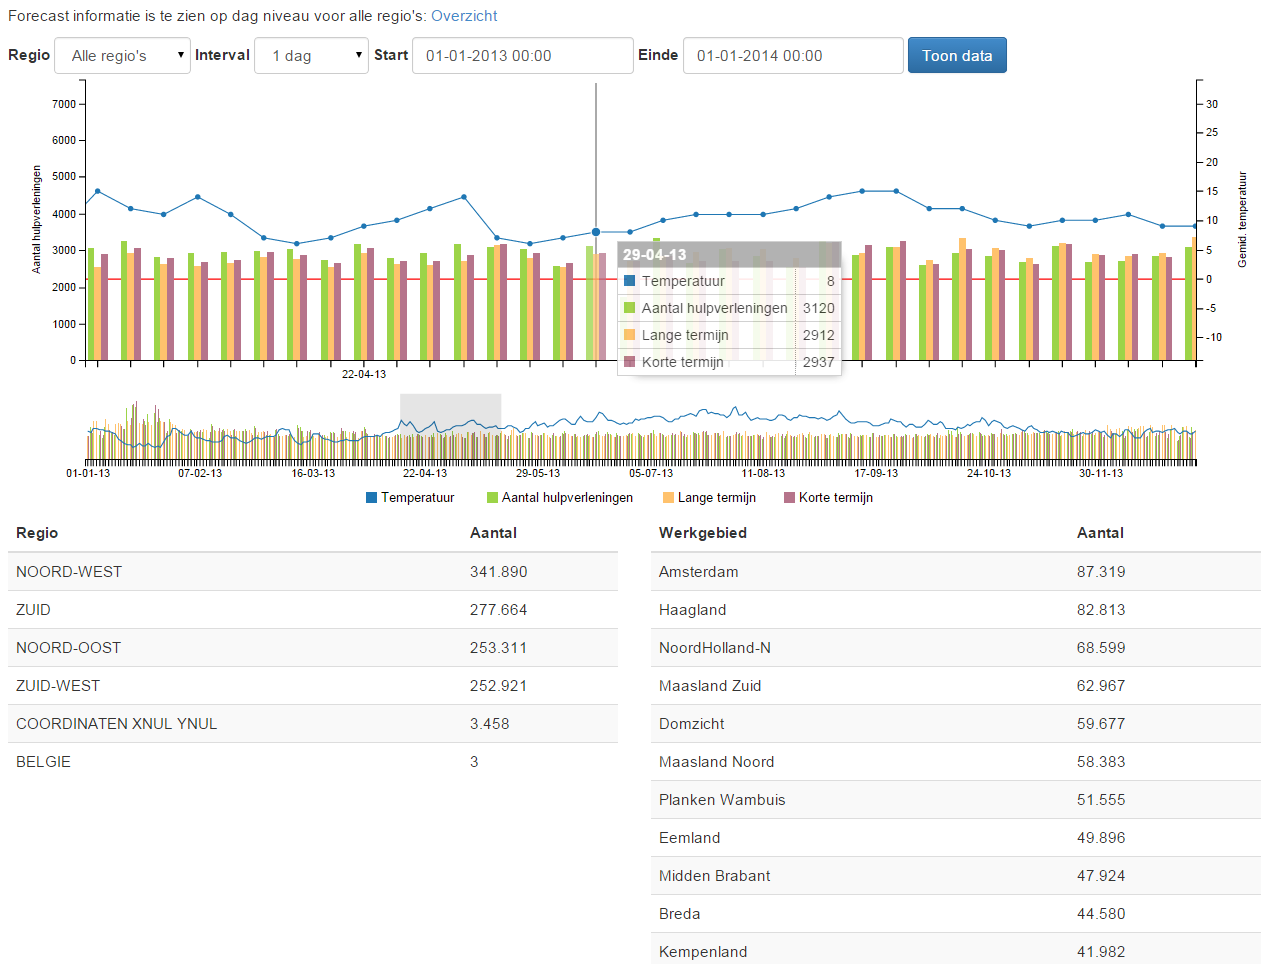
Here you can see the number of cases that needed assistance (green bar), long term forecast (orange bar), short term forecast (purple bar) and the temperature (blue line).
Data enrichment
In the image above you see a list of regions and areas. Because we want to be able to filter the data on a specific region, we needed a way to store the region and area with the measurement document. Elasticsearch provides a way to match an document (which is a measurement in our case) against stored queries. This is called the percolator.
As said before, each measure point contains the location. The location consists of a latitude and longitude. We created a separate percolator type that contains all regions and areas.
So before we index a measurement document we percolate the index with the location to see which region and area matches and store these values with the measurement document. This allows us to execute a query that filters on a region and provides us correct data.
To be continued..
This project was only a proof of concept, but provided the ANWB enough input to talk about. With open data and the power of elasticsearch to search in near real-time we created a simple application, but this could lead to something very useful. Hopefully this project will continue and gives us better traffic information in the future!