Centralized metrics with Stackdriver Prometheus Exporter
Background
Do you package your web applications in Docker container images and run those in Google Kubernetes Engine cluster? Then most likely your application depends on at least a few GCP services. As you might then already know, Google does not currently charge for monitoring data when it comes to GCP metrics. Therefore, if you want to monitor operations of Google Cloud Platform (GCP) services, such as: Compute Engine, Cloud SQL, Cloud Dataflow and Cloud Pub/Sub, using Google’s Cloud Monitoring service – Stackdriver – is a perfect choice.
Above mentioned free allotment does not apply to your application’s custom metrics. Besides, if you write applications in Java on top of Spring Boot, you may have heard of the vendor-neutral application metrics facade Micrometer. Micrometer provides built-in support for the top listed full-metrics solution for Kubernetes: Prometheus. Prometheus happens to be both open-source and community driven, and while Google claims that Stackdriver won’t lock developers into using a particular cloud provider, a read through their Stackdriver Kubernetes Monitoring documentation page currently states Beta release and limited to GKE only and something like “add-on” and “opt-in”.
An other interesting fact about Google’s approach to monitoring is that they just recently open-sourced OpenCensus: a new set of libraries for collecting metrics and distributed traces, which provides a way to expose Java application services metrics in the Prometheus data format. So one could wire OpenCensus into their Java application to expose an HTTP endpoint metrics for Prometheus to scrape, similar to Spring Boot’s Actuator Prometheus endpoint use-case. That said, Stackdriver is still unable to handle metrics in Prometheus’ data-format and you would need to use Stackdriver’s Prometheus integration – currently limited to 1,000 Prometheus-exported metric descriptions per GCP project – in order to centralize all metrics from your GCP services and Kubernetes resources, including your containerized Java applications, residing inside the Kubernetes pods.
How-to install Stackdriver Prometheus Exporter in a Kubernetes Cluster
At Trifork, as part of the weareblox project, we’ve made various GCP services metrics available to our Prometheus monitoring setup, and I thought it might be interesting to share the steps taken.
Prerequisites: This blog post assumes that you already have access to the Google Cloud Platform. If you don’t, there is a GCP Free Tier which gives you free resources to learn about Google Cloud Platform (GCP) services. It’s possible to create a sandbox GCP project and enable Google Cloud Monitoring, by logging in to Stackdriver and adding a workplace for your GCP project. When you create a GCP project from scratch, you need:
- a Kubernetes cluster, that can be created from the Google Console
- a data processing pipeline, checkout Dataflow Word Count Tutorial as an example
Tooling: Google Cloud SDK and Helm must be installed on your machine. Before installing the server portion of Helm,tiller, make sure you’re authenticated and connected to the right Kubernetes cluster. To authenticate to a Kubernetes cluster, you can use command:gcloud container clusters get-credentials <your-cluster-name>. To connect to the right cluster, you can issue command:kubectl config use-context <your-cluster-name>. Also the Prometheus Operator for Kubernetes should already be running in your Kubernetes cluster. I recommendPrometheus Operator - Quick installhow-to guide from Sysdig, when you are just starting with Prometheus Operator for Kubernetes.
1. Decide which GCP metric types you want to export
The extensive list of what Stackdriver currently supports is documented here. In the context of the weareblox project, the list looks like below:
# The comma-separated list of prefixes to gather metrics for
  STACKDRIVER_EXPORTER_MONITORING_METRICS_TYPE_PREFIXES: "dataflow.googleapis.com/job,pubsub.googleapis.com/subscription,pubsub.googleapis.com/topic,pubsub.googleapis.com/snapshot,compute.googleapis.com/instance/uptime,compute.googleapis.com/instance/cpu,compute.googleapis.com/instance/network,cloudsql.googleapis.com/database"
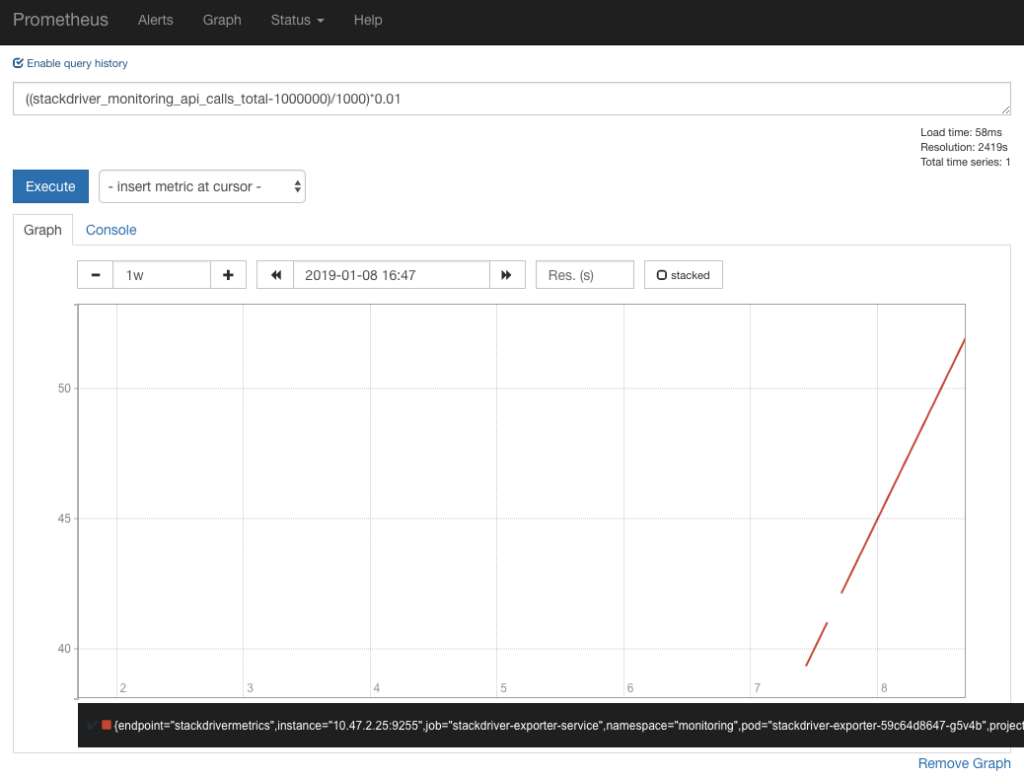
Beware: The API calls to Stackdriver are currently charged at $0.01/1,000 API calls, first 1 million API calls free. You will be able to monitor billing costs for it in Prometheus UI.
2. Install Helm chart
For getting the GCP metrics listed above into Prometheus time-series monitoring datastore, we need a few things:
- a Prometheus ServiceMonitor custom resource definition that provides the dynamic target endpoint configuration for Prometheus server to scrape for GCP metric’s time-series.
- a Kubernetes service deployment that acts as a proxy between the deployed Prometheus ServiceMonitor and the Stackdriver API.
Below some visuals of the deployment scenario:
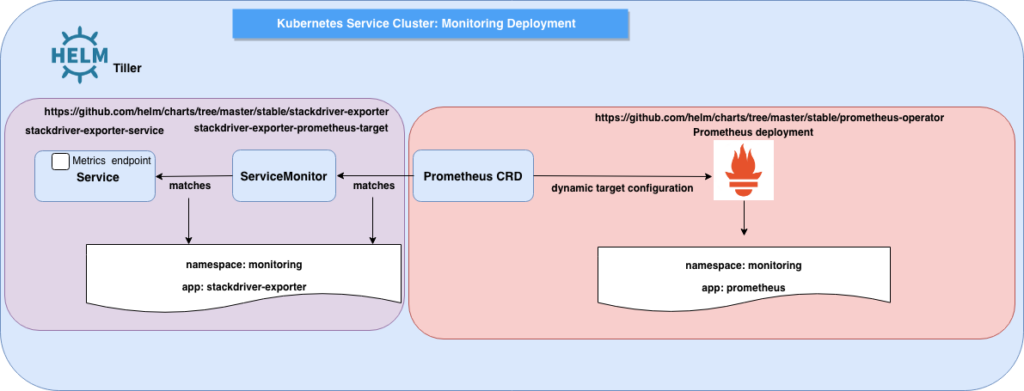
Both the Service and ServiceMonitor Kubernetes resource definitions are accessible here. The Service definition is based on community maintained helm chart – for which I’ve recently submitted a PR that got approved and merged. Another subtle tweak to the community maintained helm chart, we have used envFrom to define all of the container environment variables as key-value pairs in a Kubernetes ConfigMap.
When installing the stackdriver-exporter Helm chart, environment variables values used to configure the Kubernetes Pod can be overwritten at command line, as well it’s required to set the GCP project ID:
$ helm  upgrade --install --force --recreate-pods --tiller-namespace kube-system --namespace monitoring
--set environment_variables.STACKDRIVER_EXPORTER_GOOGLE_PROJECT_ID=project_id stackdriver-exporter ./stackdriver-exporter
To verify the installation, you can list Kubernetes Pods, Services and ConfigMaps in the monitoring namespace and you should see an output similar to below:
$ kubectl get po -n monitoring
NAME                                    READY   STATUS
kube-state-metrics-7d94879449-7fkm2     1/1     Running
prometheus-operator-6fc745c866-pwb2f    1/1     Running
prometheus-prometheus-0                 3/3     Running
stackdriver-exporter-59c64d8647-g5v4b   1/1     Running
$ kubectl get svc -n monitoring
NAME                           TYPE        PORT(S)
kube-state-metrics             ClusterIP   8080/TCP,8081/TCP
prometheus-operated            ClusterIP   9090/TCP
prometheus-service             ClusterIP   80/TCP
stackdriver-exporter-service   ClusterIP   9255/TCP
$ kubectl get cm -n monitoring
NAME
prometheus-prometheus-rulefiles-0
stackdriver-exporter-config
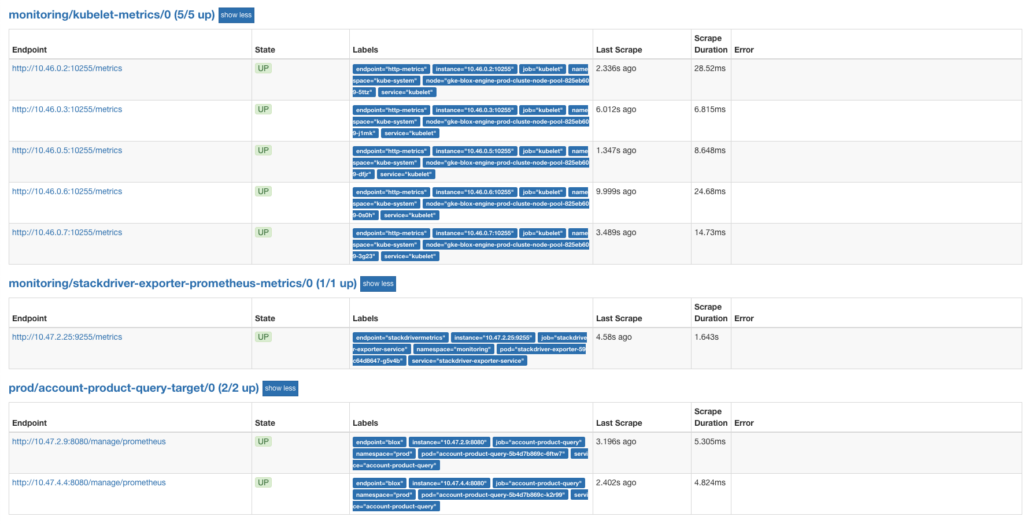
Also in Prometheus GUI, a new target named stackdriver-exporter-prometheus-metrics should be listed:
3. Create insights and Prometheus alerting rules based on GCP metrics
The advantage of having all important metrics centralized is that you can see alerts you set up in one overview:
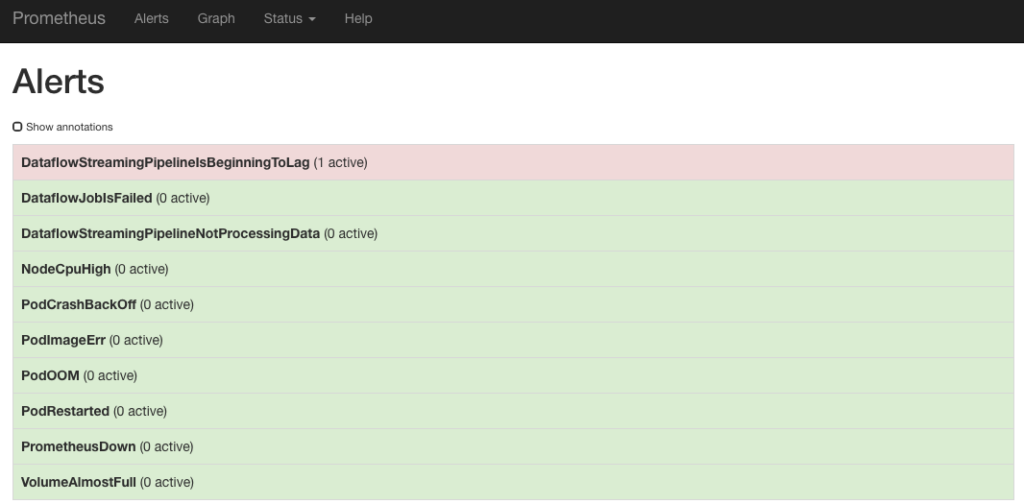
Also the way you write alerts is consistent. As exemplified above, Prometheus alerting rules are used for alerts on Dataflow metrics.
The disadvantage is that you’ll need to consider setting a time offset for individual metrics in a query.
- alert: DataflowStreamingPipelineIsBeginningToLag
   expr: stackdriver_dataflow_job_dataflow_googleapis_com_job_system_lag offset 5m > 60
In the example above, the current state of stackdriver_dataflow_job_dataflow_googleapis_com_job_system_lag metric corresponds to the 5 minutes ago state of Stackdriver metric job/system_lag.
The rule expression is checking whether the alert condition is being
met. System lag is the current maximum duration that an item of data has
been awaiting processing, in seconds.
The offset you need to set is also the value configured in the Helm
chart installation for parameter stackdriver.metrics.interval.
To sum it up, no matter the tooling or approach you choose to centralize your metrics monitoring, there will always be pro’s and con’s, so proper evaluation of what your use-case requires is important.
As an example, I like Grafana most when it comes to graphing capabilities. It also integrates out-of-the box with both Prometheus and Stackdriver metrics data sources.
Prometheus however supports templating in the annotations and labels of alerts, giving it an edge when it comes to writing alerting rules.
More information from Trifork: