Collecting data from a private LoRaWAN sensor network into Elastic
Introduction to LoRaWAN and ELK
Why LoRaWAN, and what makes it different from other types of low power consumption, high range wireless protocols like ZigBee, Z-Wave, etc … ?
LoRa is a wireless modulation for long-range, low-power, low-data-rate applications developed by Semtech. The main features of this technology are the big amount of devices that can connect to one network and the relatively big range that can be covered with one LoRa router. One gateway can coordinate around 20’000 nodes in a range of 10–30km. It’s a very flexible protocol and allows the developers build various types of network architectures according to the demand of the client. The general description of the LoRaWAN protocol together with a small tutorial are available in my previous post.
What is the ELK stack, and why use it with LoRaWAN?

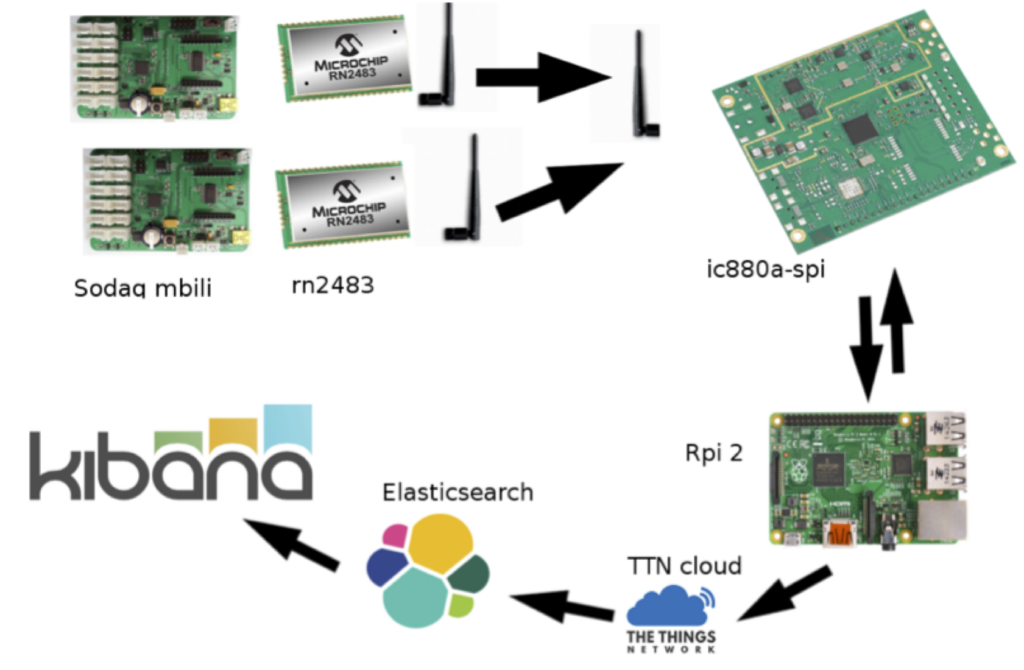
In the figure above, you can see a simplified model of what a typical LoRaWAN network looks like.
As you can see, the data from the LoRa endpoints, has to go through several devices before it reaches the back-end application. Nowadays there are a lot of tools that would allow us to gather and manipulate the data. A very good solution is the ELK stack which consists of Elasticsearch, Logstash and Kibana; these three tools allow to gather, store and analyze big amounts of data. More information and details can be found on the official website: https://www.elastic.co/.
The network architecture
Mainly, in this post I will describe how to set up a private LoRa network, and will provide details about each module between the sensor data acquisition and the data analysis in Kibana. I will describe two possible architectures: one which uses a free public cloud server, and another one which involves a private server or PC.
The hardware that I am using:
- 2x Sodaq Mbili data acquisition boards
- 2x RN2483 LoRabee modules
- ic880a-spi LoRa gateway
- Raspberry Pi 2
- PC with Ubuntu
- different types of analog sensors
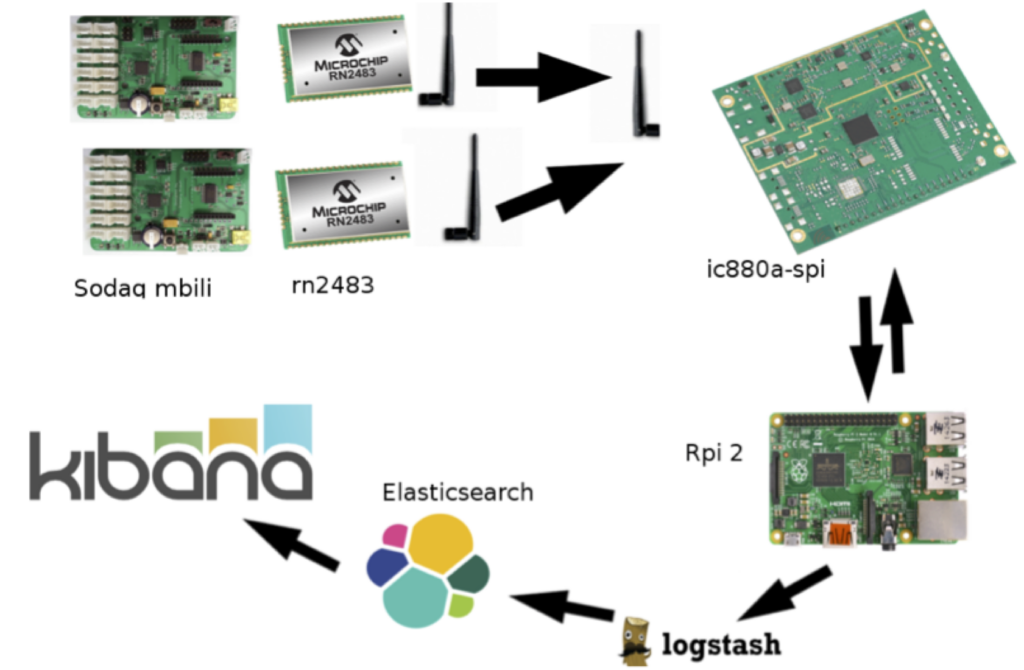
Below you can see a full model of the network architecture using the public cloud server of The Things Network:
Setting up the nodes
The Sodaq Mbili with the RN2483 are the LoRa end devices, which can read sensor data and send it to the gateway. A tutorial on how to set them up is available in my previous post (link in the introduction) or on the official support page: http://support.sodaq.com/mbili/.
For this tutorial I created a demo project which reads data from an analog sensor connected to the A0 port of the Sodaq and sends the data to the RN2483 LoRaBee. The program can be uploaded using the Arduino IDE; before doing that it’s important to change the constant called devAddr[4] to your own node addresses. In order to reserve addresses for the TTN cloud, you should register your name at: http://thethingsnetwork.org/wiki/AddressSpace. Trifork Eindhoven has reserved the address range 02:D1:DC:XX . In this example I am using node address 02D1DC09
Setting up the gateway
In this example I am using the ic880a-spi LoRa gateway from IMST GmbH, which is one of the cheapest and practical solutions for setting up a private gateway. The documentation can be found at: http://www.wireless-solutions.de/products/long-range-radio/ic880a.
The first thing is to connect the Raspberry Pi to the gateway and to the power supply. In the table below you can see the pin connection:
| ic880a pin | Rpi pin | Description | 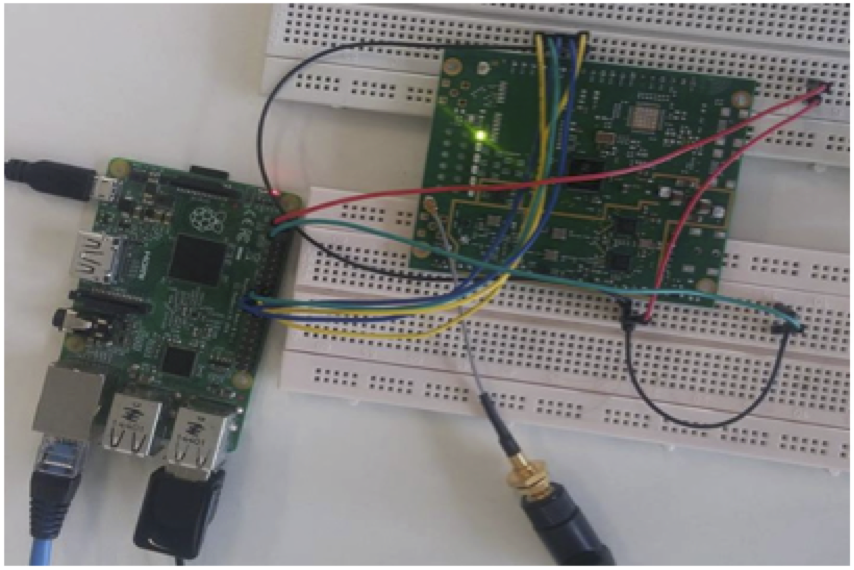 |
|---|---|---|---|
| 21 | 2 | 5V | |
| 22 | 6 | Ground | |
| 13 | 22 | Reset | |
| 14 | 23 | SPI clk | |
| 15 | 21 | MISO | |
| 16 | 19 | MOSI | |
| 17 | 24 | NSS |
It is recommended to use Raspbian Jessie Lite with no desktop graphical interface. The SPI interface has to be enabled; this can be done in the “raspi-config” under the “Advanced” sub menu.
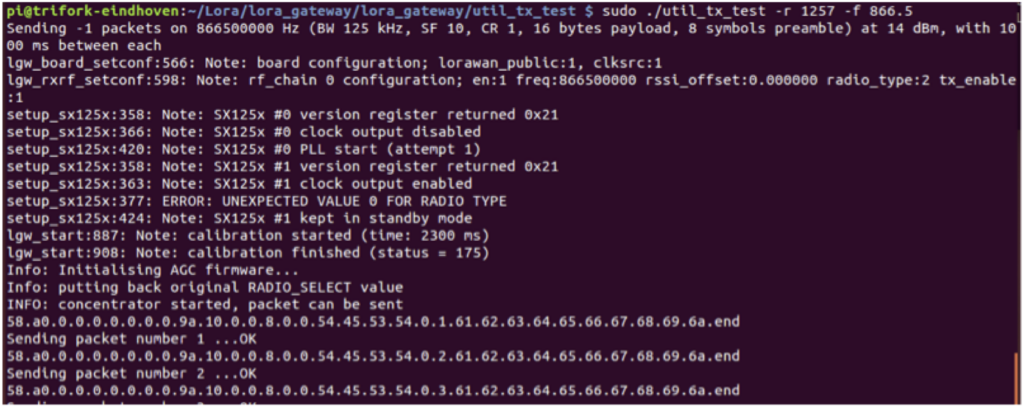
The next step is to check if the connection was done correctly; Some testing scripts can be found on git at: https://github.com/LoRa-net/LoRa_gateway. Download the files on the Raspberry Pi and open the folder util_tx_test. This script will check if the Raspberry Pi can connect to the gateway and will send test RF data packets. Run the following command in the Rpi terminal:
sudo ./util_tx_test – r 1257 -f 866.5
If the pins were connected properly, you should get the following response:
Connecting the LoRa gateway to the TTN network
The gateway can either store the data locally, send it to a private server, or send it to The Things Network (TTN) public network. First I will show how to connect to the free TTN service.
There are two ways, you can either download the basic packet forwarder and install it on the rpi: https://github.com/LoRa-net/packet_forwarder/tree/master/basic_pkt_fwd and configure it manually, or you can simply download the installer provided by TTN at: https://github.com/ttn-zh/ic880a-gateway/tree/spi. Simply run the ./install.sh api and then follow the instructions on the terminal. Make sure that the Rpi is connected to the internet before running the installation.
After the installation the Rpi will reboot, and the gateway service will always run in the background. At this point we created a public LoRaWAN gateway, that can be used by any node in the range; later in this post will explain how to make the network private and secure.
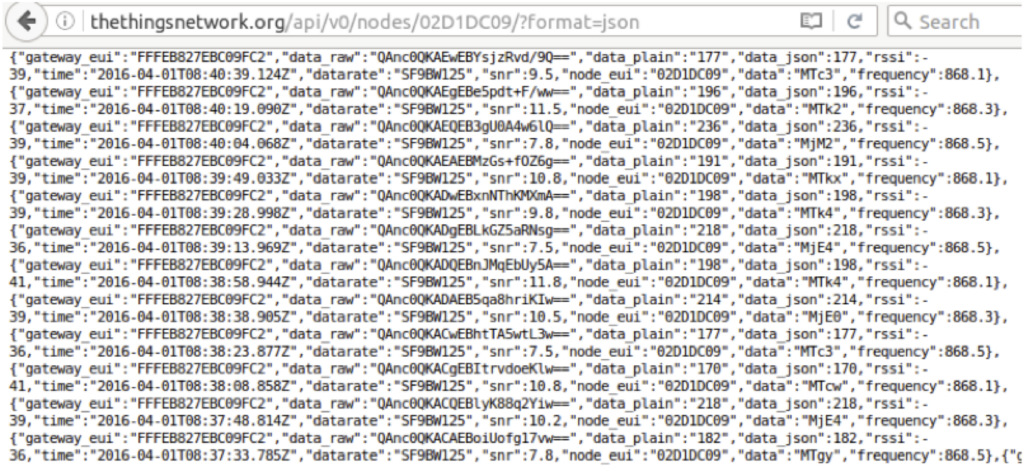
In order to check if the gateway is online, connect the Sodaq Mbili to power and let it send data to the network. Go to http://thethingsnetwork.org/api/v0/nodes/<NODE devaddr>/?format=json where devaddr is the address that you chose when setting up the node. Here you should find the messages sent by your node, as in the example below:
If there is no data on the URL, you can try running the packet_forwarder script manually.
You can find the script under /opt/ttn-gateway/bin. Simply run ./start.sh
Getting the data into elasticsearch
The next step it to get the JSON data from the URL and save it on a personal server or computer. First, install elasticsearch. An installation guide can be found at: https://www.elastic.co/guide/en/elasticsearch/reference/current/_installation.html
and kibana: https://www.elastic.co/guide/en/kibana/current/setup.html
Create a new index in elasticsearch for storing the data from the nodes:
curl -XPUT 'http://localhst:9200/LoRa_messages/'
and check if the index was created successfully with
curl 'localhost:9200/_cat/indices?v'
There are a lot of ways in which the JSON file can be imported from that URL and put into elasticsearch. For example, you can make a script like this one:
import urllib, json
import elasticsearch
import time</code>

#data = json.loads(response.read())

f = open("ttnsample.json","r")
#data = f.read()

es = elasticsearch.Elasticsearch()

def lemain():

while True:
url = "http://thethingsnetwork.org/api/v0/nodes/02D1DC09/"
response = urllib.urlopen(url)
jsonobject = json.loads(response.read())
for x in range (0,50):
es.index(index = 'lora_messages', doc_type='node_message',body = jsonobject[x])
time.sleep(15)

if __name__ == "__main__":
lemain();
As in the previous steps, make sure to use your own devaddr in the url.
Visualising the data in Kibana
The last step is to make the data readable and easy to understand. Make sure both Kibana and elasticsearch are running. Open the browser and go to 127.0.0.1:5601. Add the new index LoRa_message*. Kibana should auto detect the time filed. Below you can see how should the node data look like:
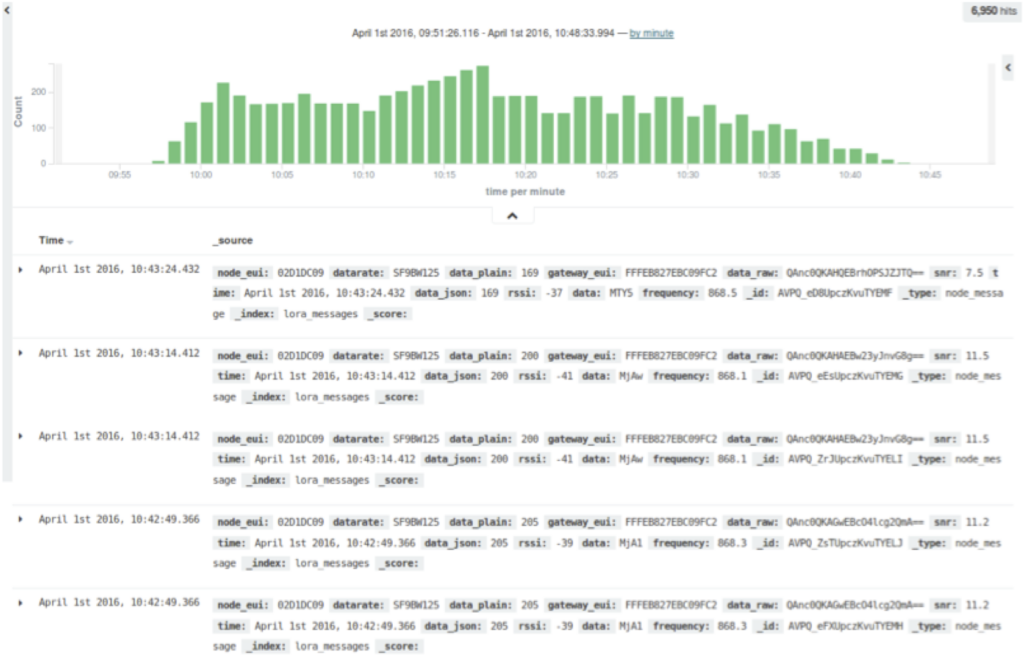
Each message contains the following fields :
- “node_eui” – the node’s devaddr
- “datarate”
- “data_plain” – the data sent from the node
- “gateway_eui” – the unique mac address of the gateway
- “data_raw” – data before decryption
- “snr” – Signal to noise ratio (it indicates the quality of the signal)
- “time” – the time at which the packet was received
- “rssi” – Received signal strength indication
- “data_json” – the same data, but in a number format.
- “data” – data in chars
- “frequency”
Kibana allows to read this data in various ways. For this example I created three simple line charts that would show the sensor data, the signal to noise ration and RSSI over time.
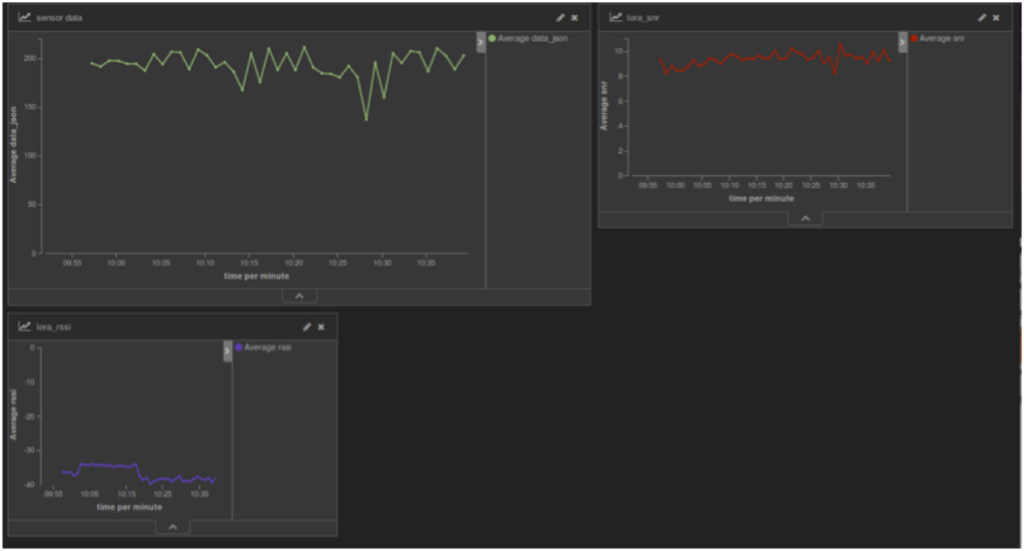
In here you can see the data from a sound sensor in the Trifork office in Eindhoven over an hour, together with the signal to noise ratio and RSSI. The dashboard can be customized in any way possible, and multiple nodes can be added.
Setting up a personal LoRaWAN network without the open TTN cloud
The main benefit of using the free TTN cloud server is that you don’t need a personal server with static IP address that has to run 24/7. On the other hand, by using their server, the data becomes public, and can be accessed by anyone. In addition, anyone can use the same devaddr for the nodes and fill your buffer with unnecessary data.
In order to redirect your data from the gateway to a personal server you can use Logstash, which can parse and filter the messages. The network architecture in this case would look like this:
Setting up the gateway
In order to configure the gateway, you have to access the local_conf.json file which can be fond in the /opt/ttn-gateway/bin folder. You have to change the parameters under the index “server” to the IP address of your server’s address and the UTP ports used for sending the data to/from the gateway, as in the example below:
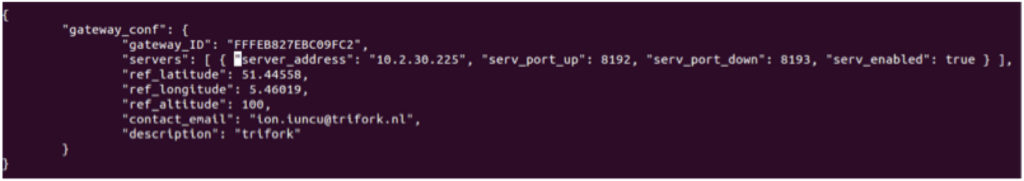
And the run the ./start.sh from the same folder. Now the gateway is sending JSON packages to your server.
Setting up Logstash
The next step is to capture the data from the UDP port and add it to Elasticsearch. In the logstash-x.x.x folder, create a config file, lora.conf for example. In this file you have to specify where does the data come from, how should it be filtered, and where it should be sent to. The following example is the minimal setup for simply redirecting all the data from the UDP port to elasticsearch:
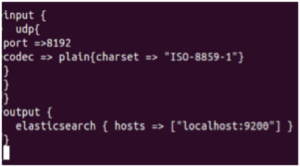
As you can see there is no filter applied, which means that all the information will be redirected. The gateway sends json packages about the gateway’s status, periodical acknowledgements and the data received from the nodes. More information can be found in the PROTOCOL.TXT file which can be found in the Rpi’s folder /opt/ttn_gateway/packet_forwarder.
In order to get only the node’s data, you need to apply a filter in logstash, or choose a specific search index in Kibana. In order to visualize the data in kibana, simply choose logstash* as the search index.
The last step is to decode the node data. In the previous setup, the data was decoded by TTN framework, but in this case you have to decode it using a base64 decoder. The encryption keys can be set up in the Arduino code by changing the variables netwskey and appskey. The decryption can be done with logstash using the cipher plugin.