Dealing with NodeNotAvailableExceptions in Elasticsearch
Elasticsearch provides distributed search with minimal setup and configuration. Now the nice thing about it is that, most of the time, you don’t need to be particularly concerned about how it does what it does. You give it some parameters – “I want 3 nodes”, “I want 3 shards”, “I want every shard to be replicated so it’s on at least two nodes”, and Elasticsearch figures out how to move stuff around so you get the situation you asked for. If a node becomes unreachable, Elasticsearch tries to keep things going, and when the lost node appears and rejoins, the administration is updated so everything is hunky-dory again.
The problem is when things don’t work the way you expect…
Computer says “no node available”
We had just gotten a client’s new website live and everything was running smoothly. Everyone went home happy. Then the e-mails started coming. “When I go to this page, it just hangs”. And the replies.. “Hmm, it works for me” – “Yeah, I got the same thing!”. Due to the nature of the page, it became obvious quickly the problem had something to do with Elastisearch. Our logs revealed the following errors periodically happening:
org.elasticsearch.client.transport.NoNodeAvailableException: No node available
        at org.e.c.t.TransportClientNodesService$RetryListener.onFailure(...)
        at org.e.a.TransportActionNodeProxy$1.handleException(...)
        at org.e.t.TransportService$Adapter$3.run(...)
        ... 3 more
As well as some of these:
2015-03-22 05:15:09.329 INFO org.elasticsearch.client.transport
[elasticsearch[Dark Phoenix][generic][T#19]]: [Dark Phoenix] failed to get node
info for[#transport#-1][tomcat01][inet[elastic01.xxxxxxxxxxx/10.9.2.221:9300]],
disconnecting...
org.elasticsearch.transport.ReceiveTimeoutTransportException:
[][inet[elastic01.xxxxxxxxxxx/10.9.2.221:9300]][cluster/nodes/info]
request_id [26382] timed out after [5001ms]
        at org.e.t.TransportService$TimeoutHandler.run(...)
        at java.util.concurrent.ThreadPoolExecutor.runWorker(...)
        at java.util.concurrent.ThreadPoolExecutor$Worker.run(...)
        at java.lang.Thread.run(Thread.java:744)
Before I continue, let me draw a diagram of our infrastructure:

Nothing too strange, except that our Elasticsearch nodes were living in a different datacenter than our application servers. This turned out to be part of the problem.
Two datacenters means the data is being routed and probably filtered by a firewall too. Firewalls like to track connections so they can pass through packets related to a connection for which it’s already determined that it is accepted. Because all this connection tracking takes up memory, connections that aren’t being used anymore are discarded. And the firewall won’t notify the other end that it has done this! The firewall has a timeout for this, typically set to anything between 1 and 6 hours. Should any packets for this connection still arrive after the timeout, the firewall will say “sorry, you say you belong to a connection X, but I don’t know anything about a connection X” and silently drop the packet, again without letting the sender know. At least that’s what our firewall did. And all the while our application thought the connection was still open and kept waiting for the reply that would never come…
What about the Elasticsearch ping?
As you can read in the Elasticsearch documentation on the Java TransportClient, there are client.transport.nodes_sampler_interval and client.transport.ping_timeout settings that control how often the Elasticsearch’s client checks whether a remote node is still accessible. By default both of these settings are set to 5 seconds, that is, the client sends a ping to each node every 5 seconds and expects a reply within 5 seconds or considers the node to be no longer accessible. So how can its connection to the node possibly be killed by the firewall when a packet gets sent over it every 5 seconds?
I misunderstood how this worked until I read this article that explains the Java API’s TransportClient much better than the Elasticsearch documentation does. The short summary is that while you might think that there is a single connection between your client and a remote node and between the nodes themselves:
![]()
actually there are (by default) 13 of them!

(Credits to Njal Karevoll of found.no for these images)
Elasticsearch calls these “channels”, not connections, but from a networking perspective, they’re all regular TCP connections. For more details, as well as how to configure the actual numbers, take a look at the NettyTransport source code.
One of these 13 connections is the ping connection. Its purpose is not keeping the real connections used for queries (6 others out of the 13) open, but just to determine whether a remote node is still reachable.
So the ping does not prevent our firewall from closing the query connections.
But surely Elasticsearch does track of whether the connections are still OK?
So doesn’t Elasticsearch periodically check its query connections to see whether they’re OK? Well, no. And yes. It delegates this responsibility to the operating system.
When opening a connection to a remote node, Elasticsearch by default sets the TCP socket option “keepalive”. The Elasticsearch documentation for its TCP Settings briefly describes this; it also states that the default is for keepalive to be on.
Keepalive tells the operating system:
- “I want to you to keep this connection open even when I’m not sending data over it”
- “If you find out that the other end is consistently not responding anymore, let me know”
The exact semantics depend on your kernel settings. By default, Linux will wait for no data to be sent over the connection for 2 hours. Then the keepalive will kick in and send a probe packet every 75 seconds, expecting the other end to reply. If 9 probes in a row don’t get a response from the other end, Linux concludes the connection is actually dead, closes it on its end, and notifies the application that had opened it (that’s our Java Elasticsearch TransportClient!)
Keepalive solves two problems we have:
- It ensures a regular flow of packets over the connection so a firewall won’t close it for inactivity
- If a firewall does close the connection, the OS will find out and notify the application so it won’t be left thinking the connection is still open
For more detailed information about TCP Keepalive, see the HOWTO.
Changing TCP keepalive settings
Now with the default settings, it would still take 2 hours plus 8 more probes every 75 seconds = 2h10m before Linux would finally be convinced the connection was dead. That was too long for us. Firstly, because it was obvious our firewall thought 2 hours was too much time for a connection to be idle. Secondly, because if a connection dies, I want Elasticsearch to find out in a matter of minutes, not hours, so it can replace the dead connection with a new one.
So we need to change the defaults. On Linux, changing kernel settings is done with the sysctl command. The settings are:
net.ipv4.tcp_keepalive_timefor the amount time to wait after the application has sent the last data packet to start sending probes,net.ipv4.tcp_keepalive_intvlfor the interval between probes,net.ipv4.tcp_keepalive_probesfor the number of probes to not get response for before concluding the connection is dead.
The values are all in seconds. To change one value, use, e.g.,
sysctl -w net.ipv4.tcp_keepalive_time=600
To change them all at once, use
sysctl -w \
net.ipv4.tcp_keepalive_time=600 \
net.ipv4.tcp_keepalive_intvl=60 \
net.ipv4.tcp_keepalive_probes=3
I chose values of 600, 60, and 3, respectively. If you’re afraid this will flood your network with probe packets, you can try a more moderate approach. Be aware that this applies to all the connections opened on the system that have the keepalive socket option set, not just the ones opened by Elasticsearch!
If you want to see the effect the settings have, you can use the following command:
watch -n 1 netstat --tcp -t -o -n
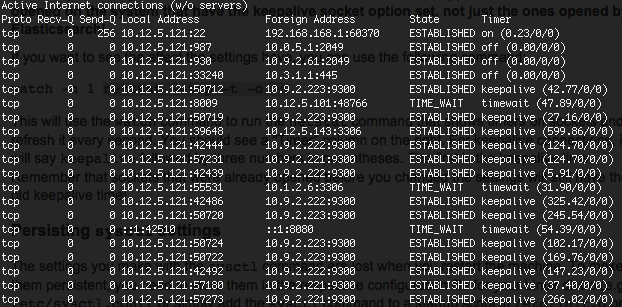
This will use the watch command to run the netstat command that shows timers on sockets and refresh it every second. You should see a “Timer” column on the right. For keepalive connections, it will say keepalive followed by three numbers in parentheses. The first is the keepalive time. Remember that sockets that were already opened before you changed the settings will still have the old keepalive time!
Persisting sysctl settings
The settings you make with the sysctl command are lost when you restart the machine. To make them persistent, you need to store them in the respective configuration file for your Linux distro (e.g. /etc/sysctl.conf), or simply add the sysctl command to a startup script in /etc/init.d or /etc/rd.d.
Conclusion
Properly configured TCP keepalive settings can ensure that connections from an Elasticsearch client to nodes on another network are kept open, even when they aren’t being used for a while. They also ensure that if a connection does die (because a firewall drops it, or because of a network split), the client will be notified quickly. This should avoid hangs and random NoNodeAvailableExceptions when using Elasticsearch from Java.
tl;dr: if you get NoNodeAvailableExceptions from the Java Elasticsearch Client when the nodes are on a different network, lower your Linux TCP keepalive times with:
sysctl -w \
net.ipv4.tcp_keepalive_time=600 \
net.ipv4.tcp_keepalive_intvl=60 \
net.ipv4.tcp_keepalive_probes=3