Evaluating elasticsearch and marvel on the raspberry pi

The past years I have been working with search solutions, mostly elasticsearch. During this time a bought myself a raspberry pi and installed java and elasticsearch on it. Then I put it in the closet and it did not come out anymore. Than a few weeks a go the guys from elasticsearch released marvel. Marvel is a monitoring tool for your elasticsearch cluster. Suddenly I realized what the problem with the raspberry pi is. It is not fun to have just one. Therefore I decided to buy two more and create an elasticsearch cluster. With this cluster I can do experiments. The first experiment is evaluating marvel.
In this blog post I will show some of the concepts of marvel. To make this possible I will also explain the steps I had to take to install elasticsearch on my raspberry pi cluster.
Preparing the raspberry pi’s
If you google for elasticsearch and raspberry pi you will most likely reach a 4 part blog post that goes all the way to install elasticsearch. If you ask me, this post is outdated. There is two reasons why.
- ONE – Java is installed out of the box if you use raspbian.
- TWO – You can make use of the deb package provided by elasticsearch
So what to do now. Use the quick start guide to install the Noobs distribution on your pi. Than chose the raspbian install. This will take a while, in the end you get the config screen. Use this screen to set the host name and the time zone. Also go to the advanced part to enable ssh acces.
I have chosen to use a router for playing with the pi’s. In this router I have given them a fixed ip. Than on my laptop I have changed the hosts file to translate the ip in logical names.
When running the pi’s there are few reasons why you want to attach them to the internet. First one is to download updates as well as elasticsearch software. The second one has to do with time. When you boot the pi without an internet connection the time will not be right. There is no Real Time Clock in the pi. Therefore you need to set the time manually. This is no problem, but it is just easier if your are connected and it does find the time automatically. Having the right time is very important for marvel. If your servers are days behind you need to adjust the time in marvel to go back longer. It is easier to change the time of your pi. Check the current time using
date
Than change the time if required using the following command
date -s "8 FEB 2014 15:20:00"
To make sure we are up to date, and if you are connected to the internet. Update installed software:
sudo apt-get update
sudo apt-get upgrade
Time to do what we were about to do all the time. Install elasticsearch
Installing the elasticsearch cluster on the pi’s
To make life easy, I have chosen to download the debian package and install it with the package manager
# wget https://download.elasticsearch.org/elasticsearch/elasticsearch/...
     ...elasticsearch-0.90.11.deb
# sudo dpkg -i  elasticsearch-0.90.11.deb
That is it, really, now you have elasticsearch running. Check by going to http://<host>:9200. You should get a response similar to:
{
  "ok" : true,
  "status" : 200,
  "name" : "red-pi",
  "version" : {
    "number" : "0.90.11",
    "build_hash" : "11da1bacf39cec400fd97581668acb2c5450516c",
    "build_timestamp" : "2014-02-03T15:27:39Z",
    "build_snapshot" : false,
    "lucene_version" : "4.6"
  },
  "tagline" : "You Know, for Search"
}
But now everything is using defaults. Because the pi has limited resources we have to make some adjustments. Just because we can I changed the name of the cluster and the names of the nodes. Changing the name of the nodes is not only fun, it is also smart to recognise the nodes in the marvel screens. For now I leave the auto discovery on true, not a lot of other machines will connect to the network. Changing these parameters is done in the elasticsearch.yml. You can find this file in /etc/elasticsearch. Than in the file /etc/default/elasticsearch we can change the amount of memory to give to elasticsearch. Because the pi has limited resources (512 Mb) we give half of it to elasticsearch by changing the parameter: ES_HEAP_SIZE=256m.
Installing marvel
You need to restart before changes to take effect, but hold your horses. First we install the marvel plugin. If you still have the internet connection the easiest way to do it is using the following command (on all your nodes)
# cd /usr/share/elasticsearch
# bin/plugin -i elasticsearch/marvel/latest
You can also download it once and than copy it to all your pi’s. Than you can replace the last command with the following.
bin/plugin -i marvel -u file:///home/pi/marvel-latest.zip
Installing sigar
By default elasticsearch uses sigar. This library is used to obtain information about the jam, file system and io opts. The problem is that it requires a native library and that is not provided by the default package. Therefore you need to copy the file libsigar-arm-linux.so to the elasticsearch library.
# cp libsigar-arm-linux.so /usr/share/elasticsearch/lib/sigar/
You can download this file from this forum post.
Some optimisations
Marvel is kinda heavy for the pi’s. Therefore it can help to do some optimisations. One of them is removing the replica. By default marvel creates an index per day with one shard and one replica. Than two of the pi’s constantly work on 90+%. Marvel makes use of a index template. Do not replace this template! We add a template with a higher order that can replace some of the properties in the other template.
PUT /_template/custom_marvel
{
    "template": ".marvel*",
    "order": 1,
    "settings": {
        "number_of_replicas": 0
    }
}
In case you have already created some indexes with marvel, you can change the settings for these indexes as well.
PUT /.marvel-2014.02.06,.marvel-2014.02.07/_settings
{
    "index": {
        "number_of_replicas": 0
    }
}
SO now we have one pi with a high cpu. So where is this cpu coming from? Well, marvel inserts a lot of documents. By default each 5 seconds a probe is done and the results are stored. Each result consists of around 15 documents, so around 3 per second. Than when you have the marvel dashboard open around 1-2 queries are executed per second. Both values can be altered. The number of queries is easy to change, just change the refresh frequency at the top of the screen. You can also change the frequency of probes. This is a little bit more work. You need to add a property to the file elasticsearch.yml.
marvel.agent.interval: 10s
Now it is time to reboot elasticsearch:
# /etc/init.d/elasticsearch restart
Marvel and what it is
With marvel you can get an overview of the state of your elasticsearch cluster. When problems arise you can drill down to all aspects of the nodes in your cluster as well as the indexes.
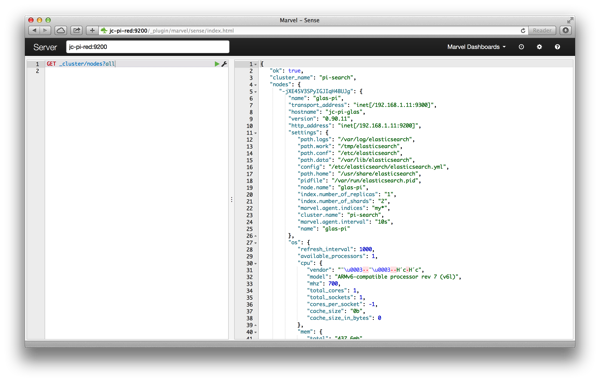
Marvel uses the excellent api that elasticsearch itself is providing to get data about your cluster. If you have acces to a cluster you should try out how much information you can obtain. Some of the interesting urls that you can use are:
- /_cluster/stats?human
- /_cluster/state
- /_cluster/nodes/stats
- /_cluster/nodes?all
A very easy way to try it out is to use the sense tool. You have acces to this tool from the marvel screen. Go to Marvel Dashboards and select the sense tab. The result is the following screen.

The following screen gives an idea of the main screen of marvel. Here you see the overview. Colours indicate problem. Using the overview you can drill down easily. In the top you see the totals for the complete cluster, the number of documents, queries and inserts.

The following image shows the node overview, you can see we have three nodes (three pi’s). You can also see that the pi-wit is handling the marvel index. This is having a hard time keeping up. You can also see that elasticsearch prefers more disk space, therefore Disk Free Space is red for all nodes.

Than the final image I want to show from the overview desktop is the index overview. Here you can see that I do not use the index mymusic yet, it does not have documents.

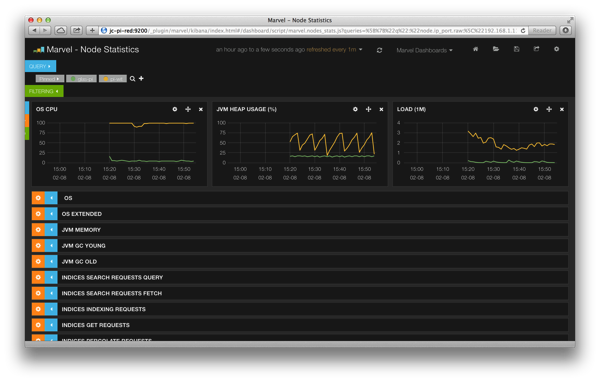
The final thing I want to show is drilling down, if you select two nodes in the node overview and push the Dashboard button. You go to the screen where you can request very detailed information about the nodes.

So how was this possible. The next section discusses the steps to install the pi’s with elasticsearch.
Conclusions
That is it, now you can monitor your elasticsearch cluster running on raspberry pi’s. One thing is clear to me. The raspberry pi’s are not really useful in a production environment for elasticsearch. This was not really a surprise to me. Still it is fun to play around with. In the future I am going to do some experiments, trying to simulate split brain and those can of things. So stay tuned. If you have special requests for my cluster let me know.