How to Remotely Debug Application Running on Tomcat From Within Intellij IDEA
 This post would look into how to tackle and debug issues in scenarios where they only occur in production (or other remote environment) but not in development environment. As anybody who has been in this kind of situation would acknowledge, trying to pinpoint the cause of these kind of “issues” might quickly end up being a practice at taking shots in the dark: a very time-consuming and inefficient process.
It was this kind of situation I recently found myself, where, I had to rectify certain issues that were occurring in the production environment but could not be reproduced on the development machine.
Fortunately enough, the said issues could be reproduced in the testing environments (which is as close to the production environment as possible). But having the issues reproducible in the test environment was good In that it confirms the issues needed to be fixed, but it was of little help in actually tracking the issues down, finding the cause and fixing it. Relying just on log outputs was not enough…What if I could debug the test environment from my machine?
It was at this stage that I thought about remote debugging and if there exist the possibility of having an application run in a remote JVM and still be able to intercept its execution from the copy of the source code running on a local IDE: sounds just like what would get the job done.
And sure this is very possible. I looked into what is needed; the set up and all. It did not sound complicated. So, together with the help of a colleague, Thijs Schnitger, was able to get it up and running without much hassles.
This post thus describes the procedure of setting up the ability to remotely debug a JVM application from within an IDE. The post outlines the procedure using IntelliJ IDEA as the IDE, and the remote application to be debugged would be web application running on Tomcat. The steps outlined below should apply with any remote JVM application and any IDE, although the exact steps may differ, the general idea would remain same. The post also gives a brief overview of the technologies that makes remote debugging possible.
The Configuration Instructions
The process of getting remote debugging working involves two steps.
- Starting Tomcat with remote debugging enabled and
- having your IDE, in our case IntelliJ IDEA, to be able to debug the remote tomcat application.
There are couple of ways to get the first part done and it slightly differs depending on which OS environment your Tomcat instance is running on. But, regardless of the method used, the main idea behind the configuration remains the same; which is: pass specific start up options to the JVM that would enable remote debugging.
The JVM start up arguments needed to have remote debugging activated can be set via JPDA_OPTS, CATALINA_OPTS and JAVA_OPTS although using JAVA_OPTS is not usually advised, reason being that the setting specified via JAVA_OPTS, is exposed to all JVM applications, but with CATALINA_OPTS the settings defined is limited only to Tomcat.
USING JPDA_OPTS
Using the JPDA_OPTS, option you would have the needed start-up argument set in a file named setenv.sh (or setenv.bat if on windows). Create the file if it does not exist already. Have it in the CATALINA_HOME/bin directory. And add this to the content:
<br> export JPDA_OPTS=&quot;-agentlib:jdwp=transport=dt_socket, address=1043, server=y, suspend=n&quot;<br>
and if on Windows:
<br> set JPDA_OPTS=&quot;-agentlib:jdwp=transport=dt_socket, address=1043, server=y, suspend=n&quot;<br>
What these settings basically do is to enable remote debugging and configure available options: specifying the communication protocol between the running application and the debugger, (ie transport=dt_socket) the port at which the remote application should debugged (ie address=1403). The server=y setting indicates that this JVM would be the one to be debugged while suspend=n is used to tell the JVM to execute right away and not wait for an attached debugger. If set to “y” then the application would be suspended and not run until a debugger is attached.
A good situation where you would want to have suspend=y is when debugging an issue that prevents an application from starting successfully, having suspend=y would make sure that the JVM waits for the remote debugger to connect before attempting to start and run the application.
Although the settings can be put directly inside catalina.sh (or catalina.bat) it is always preferable to have extra configurations in the setenv.* file. It would be automatically be picked up by Tomcat.
Note that another options you may encounter that may be used to enable remote debugging is:
-Xdebug -Xrunjdwp:transport=dt_socket,server=y,address=1043, suspend=n
The difference between this and the recommended setting is that the -Xdebug and -Xrunjdwp option is the old way of enabling remote debugging; it applies to JVM prior to JAVA 5.0 (JAVA 1.5.0) while -agentlib:jdwp option applies to JAVA 5.0 and beyond…And with this configuration in place, you can then start Tomcat via the command line arguments:
$CATALINA_HOME/bin/catalina.sh jpda start
USING JAVA_OPTS OR CATALINA_OPTS
If you have Tomcat running as a windows service, then configuring Tomcat to start up with ability to be debugged remotely is done by simply specifying the start up arguments in the run properties.
Open up the Apache Tomcat properties dialog box, and under the Java tab add the required start up option:
-agentlib:jdwp=transport=dt_socket,address=1043,server=y,suspend=n
Make sure that each entry is on a new line and there are no spaces between the options
With this added to the options, starting the Tomcat service would have remote debugging enabled.
If per chance you are not running Tomcat on Windows as a service, to enable remote debugging, you need to specify the required options in the setenv.bat file:
set CATALINA_OPTS=&quot;-agentlib:jdwp=transport=dt_socket,address=1043,server=y,suspend=n&quot;
If you are running on linux you have:
export CATALINA_OPTS=&quot;-agentlib:jdwp=transport=dt_socket,address=1043,server=y,suspend=n&quot;
Start Tomcat like you would normally then do by running the catalina.bat or catalina.sh script.
STARTING TOMCAT WITH JPDA
Another way of running Tomcat with remote debugging is to use the JPDA switch, to start Tomcat; this would automactically have remote debugging enabled with its options set to default values.
For example, this:
catalina jpda start
would start Tomcat with the following settings:
-agentlib:jdwp=transport=dt_socket,address=8000,server=y,suspend=n
But what if you want to change any of these default settings and still use the JPDA start switch? This can be done by setting the appropiate environment variable for the options as required by Tomcat. The environment variables are:
JPDA_TRANSPORT: to specify JPDA transport used
JPDA_ADDRESS: to specify port for remote debugging
JPDA_SUSPEND: to specify if to suspend JVM after startup
so running:
&amp;amp;amp;amp;amp;amp;nbsp;export&amp;amp;amp;amp;amp;amp;nbsp;JPDA_ADDRESS=&quot;8080&quot;
and then
catalina jpda start
would have remote debugging possible on port 8080.
Configuring IntelliJ IDEA
With the remote JVM running the Tomcat started with the required start up arguments, the next thing to do is to configure the debugger in IntelliJ IDEA.
There are two ways to this configuration: The Remote Tomcat settings options or Remote settings option.
Using The Remote Tomcat Settings Option.
Click on Run ➝ Edit Configuration:
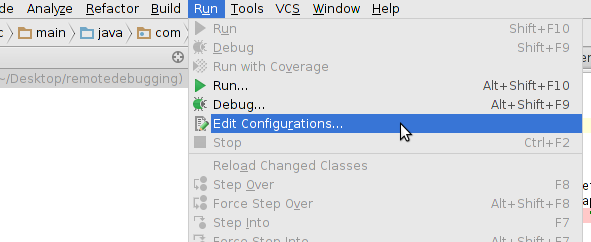
The Edit Configuration… settings dialog box, pops up.
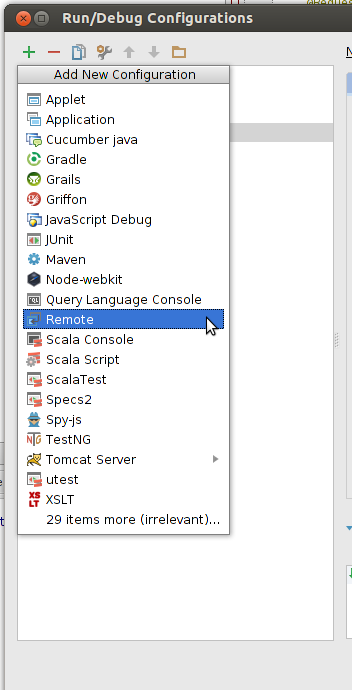
Click on the + button on the top left ➝ Tomcat Server ➝ Remote. As shown below:

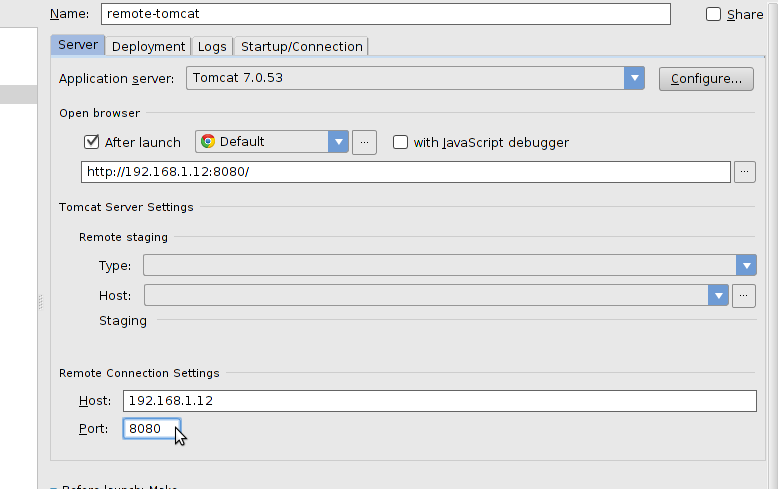
Next is to fill in the required settings.
On the Server tab, specify the host details and the port the remote Tomcat is running on:
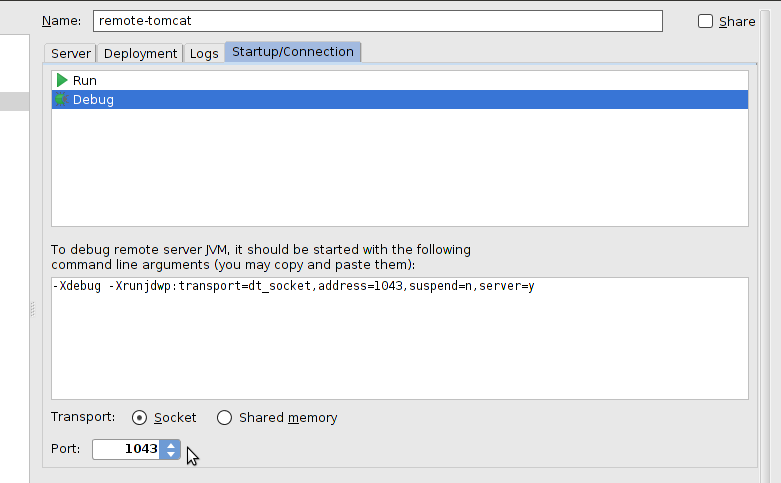
Then switch to the Startup/Connection tab, where you would specify the details of the remote JVM needed to be debugged from intellij IDEA.
Click on Debug and specify the port you specified while configuring the Tomcat; 1043 in our case.
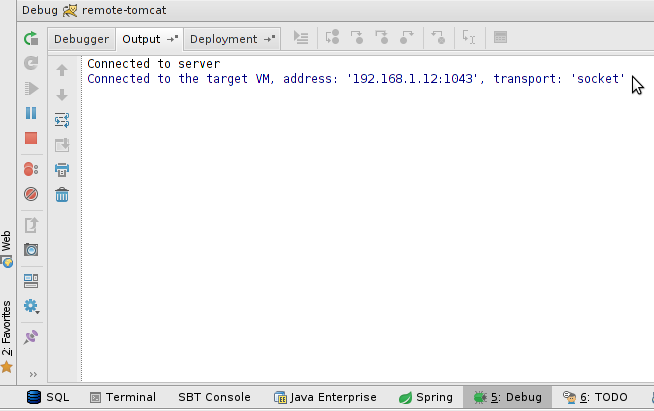
And that is it. Click on Ok to save your changes, then start the debugging session by pressing the debug icon or by using the keyboard shortcut (shift + f9)
If all the configuration is set up correctly, you should see a notice that the IDE has successfully connected to the target VM in the Debug tab in the bottom console:
Using the Remote settings option
Open the Edit Configuration settings as done in the previous option but instead of selecting the Remote Tomcat, select the Remote option:
The Remote settings dialog box appears where you can specify the required configuration; remote host, port, project etc:
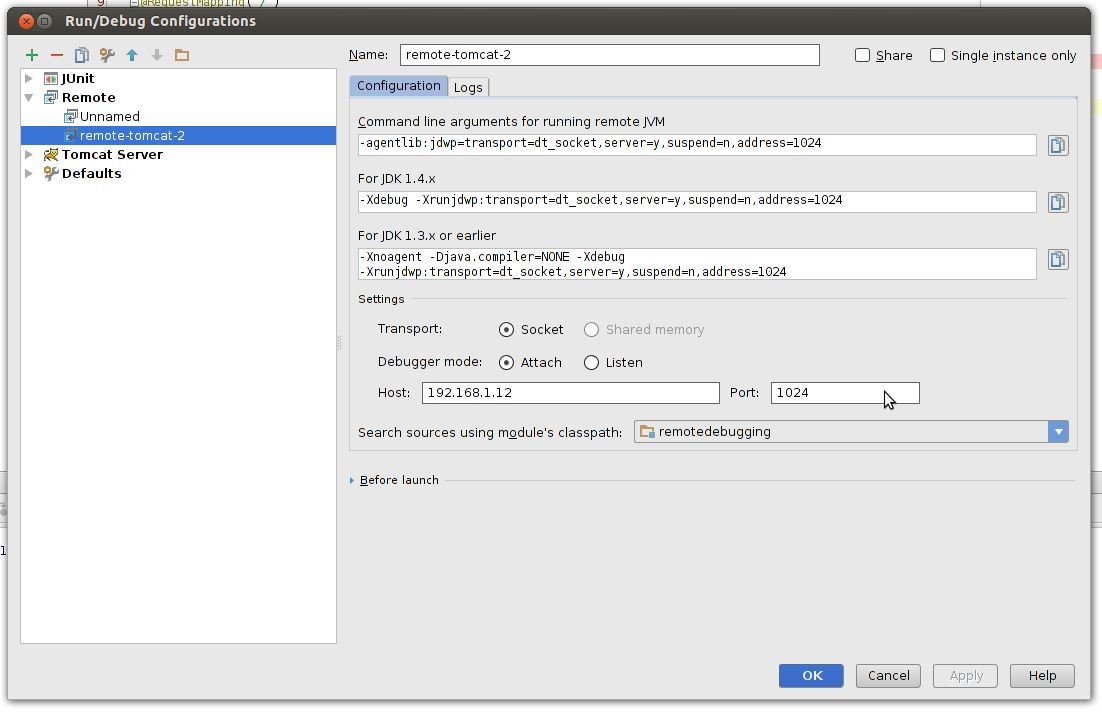
As you can see from above, the interesting thing about the Remote option is that, apart from allowing you to configure intelliJ IDEA, it also list the various configurations required to start up the remote JVM in other for remote debugging to work. Might come in handy.
Specify the required settings, click Ok to save changes, and start the debugging session. You should also see the notice that IntelliJ has successfully connected to the remote VM.
Once this is done, you should then open the source code of the application you have running on the remote Tomcat, put a breakpoint where required and you can go ahead and start debugging as if the application is running on your local machine.
So that is it with the configuration, the next question is, what makes all these fit and work together?
Let us take a quick work through of the technology at play that makes remote debugging JVM possible.
How Remote JVM Debugging Works
It all starts with what is referred to as Agents.
The JVM, which runs the complied .class sources has a feature that allows externally libraries (written in either Java or C++) to be injected into the JVM, just about runtime. These external libraries are referred to as Agents and they have the ability to modify the content of the .class files been run. These Agents have access to functionality of the JVM that is not accessible from within a regular Java code running inside the JVM and they can be used to do interesting stuff like injecting and modify the running source code, profiling etc. Tools like JRebel makes use of this piece of functionality to achieve their magic.
And to pass an Agent Lib to a JVM, you do so via start up arguments, using the -agentlib:libname[=options] format.
So in the configuration we had above:
<br>
-agentlib:jdwp=transport=dt_socket,address=1043,server=y,suspend=n<br>
We were actually passing an Agent Lib named jdwp to the JVM running Tomcat. The jdwp is a JVM specific, optional implementation of the JDWP (Java Debug Wire Protocol) that is used for defining communication between a debugger and a running JVM. It’s implementation, if present is supplied as a native library of the JVM as either jdwp.so or jdwp.dll
So what does it do?
In simple terms, the jdwp agent we pass is basically serving the function of being a link between the JVM instance running an application and a Debugger (which can be located either remote or local). Since it is an Agent Library, It does have the ability to intercept the running code, create a bridge between the JVM and a debugger, and have the functionality of a debugger applied on the JVM.
Since in the JVM architecture, the debugging functionality is not found within the JVM itself but is abstracted away into external tools (that are aptly referred to as debuggers), these tools can either reside on the local machine running the JVM being debugged or be run from am external machine. It is this de-coupled, modular architecture that allows us to have a JVM running on a remote machine and using the JDWP, have a remote debugger be able to communicate with it.
When IntelliJ IDEA was configured above, what was actually been done is to specify to the debugger tool within IntelliJ IDEA the host where the running JVM it needs to debug resides and the port through which it should connect with.
All the specification that outlines this modular architecture is contained in what is referred to as the Java Platform, Debugger Architecture, JPDA (this explains the JPDA in the JPDA_OPTS method used above) and you can read a much detailed overview of it here: Java Platform Debugger Architecture Overview.