Maximum shard size in elasticsearch – revisited
 In my last blog post on the subject, I tried to find the maximum shard size in elasticsearch. But in the end all I could say is that elasticsearch can index the whole English Wikipedia dump in one shard without any problem but that queries are painfully slow. I couldn’t find any hard limit because I didn’t know exactly what will be the problem. I was expecting indexing to slow down before the querying, thus I couldn’t do a relevant querying test with a smaller index. Armed with my knowledge from my previous experiment, in this post I will try to show what the maximum shard size is for a given set of conditions.
Defining what’s acceptable
Regardless of what I learned doing the first part of this experiment, unless a set of fixed requirements and performance criteria is defined, the answer to the maximum shard size question will always be “it depends”. To avoid this, I arbitrarily defined the following test conditions:
- querying and indexing will happen concurrently
- querying with 200 concurrent users
- acceptable query performance (average): 1 second
- indexing with 1 thread
- indexing speed is not a concern
I kept all the other test specifications the same as my previous test, using the same Wikipedia dump with the same elasticsearch mapping, the same Java code for indexing the documents and the same JMeter test plan to simulate the concurrent querying. Basically the only differences from my previous experiment are the simultaneous indexing and querying together with lowering of the concurrent searches from 500 to 200.
Indexing results
Using an empty index with a single shard, I started the process of indexing the Wikipedia articles in elasticsearch. I also started the JMeter test simulating the 200 users concurrently querying the system. Immediately, the indexing times seemed a little slower than before. I didn’t realize how slow indexing actually was until I checked the times graph, some 11 hours after I started the test:
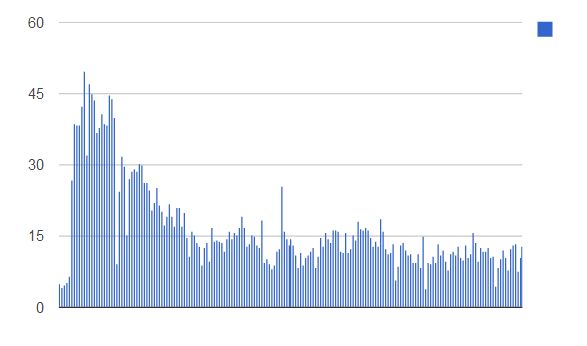
When indexing Wikipedia without querying, every batch of 1000 documents took, on average, ~1.5 seconds. The simultaneous querying slowed down the indexing speed almost 4 times, every batch taking on average close to 6 seconds. More importantly, in the first part of the test, batches regularly took more than 30 seconds, with spikes approaching the 50 seconds mark. Nevertheless, there were no errors while indexing and, as I said in the beginning, indexing speed is not a concern for finding the maximum shard size.
Querying results
Because I started with an empty index, in the first few of hours of the test, the querying speed was really good. As soon as the index started to fill though, the exponential increase in query times was evident:
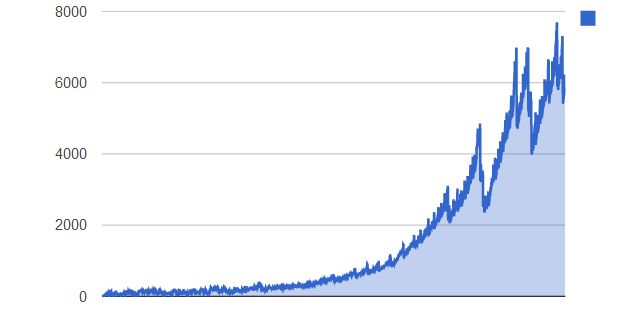
My performance criteria of 1 second average was exceeded when the index grew to 435000 documents (or 1.3GB in data size). And that is, in my given situation of requirements, data structure and hardware, my maximum shard size.
Server monitoring
The more observant readers will have noticed by now that my query response time graph showed two big drops after the times had already started increasing. I wish I could say precisely why this happened, but I was using only JConsole to monitor the JVM and it crashed midway through my test. Most likely the drops are related to a Lucene segment merge, but without monitoring information I can’t be sure. This brings me to a very important point: if you are planning to perform this sort of test for your production environment, monitoring all the servers is as important as defining the test conditions. Even if the test results are acceptable, but especially if they’re not, you need to know where the bottlenecks in performance are.
There are lots of server monitoring tools out there, but I quickly want to mention an API which elasticsearch exposes. The stats API gives information not only about the status of your server, but also statistics about the JVM and, more importantly, about elasticsearch itself (including merge, refresh and cache information). If you have elasticsearch running on localhost using the default port, you can use this link to see all the information it exposes for your cluster.
Of course, the stats API only gives you snapshot information regarding the state of the cluster. The problem is how to get a historical overview of this information. The Paramedic plugin is nice, but it only provides a small set of the available information with limited history. Luckily, more and more people are using elasticsearch and it seems that almost every day a new tool or plugin designed to make your life easier with elasticsearch pops up.
One of the developers with whom I worked on the Beeld en Geluid elasticsearch project developed a nifty little tool that indexes all the information from the stats API in a separate elasticsearch index. You can then use Kibana to analyze the full historical information. Full details on how to install and use this tool can be found on the project’s Github page.
Putting numbers together
Although I imagined that queries will become slower at one point or another during the test, two things surprised me. First, the clear exponential increase in query times – I expected the drop in performance to be more linear. Second, the seemingly low number of documents where my 1 second “threshold” was reached. The number was actually much lower than I expected (my guess would have been somewhere closer to 2 million documents). I started to think how the test was performed. On my development laptop I was running the elasticsearch node, the indexing script, JConsole and JMeter simulating 200 concurrent users – that’s a lot to handle, even for a 4 core machine. This explains the low “maximum shard size” for my particular situation.
A takeaway is that the test performed here is still empirical. In a production setup elasticsearch will run on one machine, most likely the indexing on another and most definitely JMeter won’t be running with 200 threads on either machine. The most important thing to remember that the number I found is specific for my situation – your millage will vary.
If you are planning to do capacity management for your elasticsearch cluster but you’re not sure where to start, or you just have some questions about elasticsearch, we’re just a short email away.