Server-side clustering of geo-points on a map using Elasticsearch
Plotting markers on a map is easy using the tooling that is readily available. However, what if you want to add a large number of markers to a map when building a search interface? The problem is that things start to clutter and it’s hard to view the results. The solution is to group results together into one marker. You can do that on the client using client-side scripting, but as the number of results grows, this might not be the best option from a performance perspective.
This blog post describes how to do server-side clustering of those markers, combining them into one marker (preferably with a counter indicating the number of grouped results). It provides a solution to the “too many markers” problem with an Elasticsearch facet.
The Problem
The image below renders quite well the problem we were facing in a project:
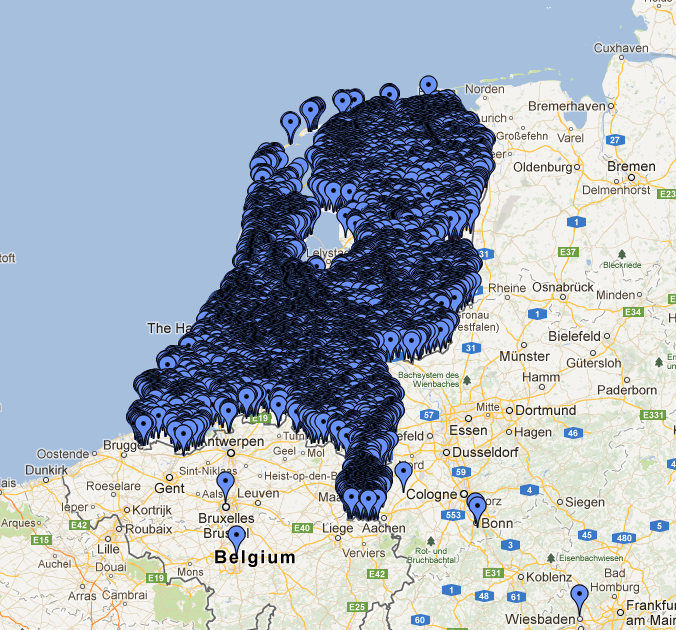
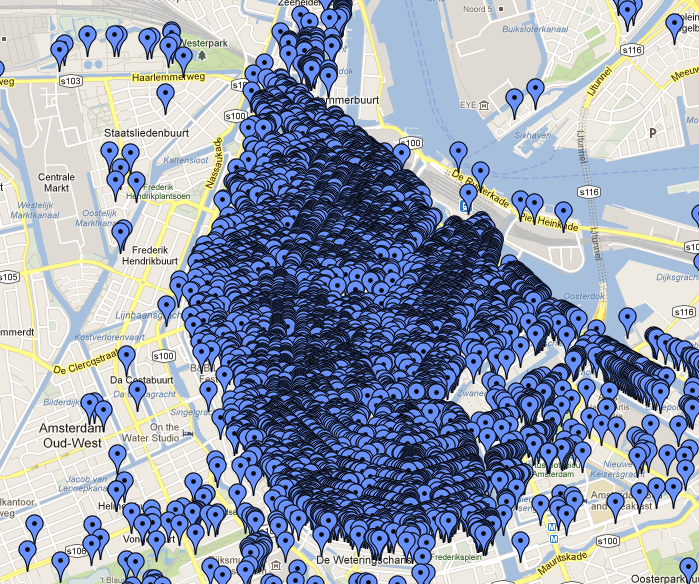
The mass of markers is so dense that it replicates the shape of the Netherlands! These items represent monuments and other things of general interest in the Netherlands; for an application we developed for a customer we need to manage about 200,000 of them and they are especially concentrated in the cities, as you can see in this case in Amsterdam: The “draw everything” strategy doesn’t help much here.
Looking for a solution
This article by Google gives a good overview of the problem, but it presents only client side solutions. As the start of this post anticipates, client side processing is not good in our case: if the browser received all of the 200,000 points of interest the webpage would freeze every time the user drags or zooms.
Therefore we looked at means for doing this server side.
Since we are using Elasticsearch as our storage, we searched for a solution which was either built-in or available in a plugin, and found https://github.com/zenobase/geocluster-facet. It is an Elasticsearch plugin which uses a clustering algorithm to group nearby documents.
We installed the plugin and tried some use cases, and although liking the base idea we concluded that we needed more control over the grouping: in our tests, the way groups were calculated by the plugin varied a lot depending on the particular bounding box used in the query. This would result in unstable group icons while a user pans around the map.
The “grid” idea mentioned in Google’s article would allow us to fine control the level of grouping. It basically consists in dividing the earth’s surface in cells of a rectangular grid, with the grid lines following meridians and parallels, and grouping the items according to the cell they fall into. Since we want the grouping level to vary with the zoom level, there is no single grid which accommodates all cases but instead grids of different granularity are needed. If the map is showing the whole world, the surface should be divided in a few ‘mega’ cells, spanning big portions of the continents; on the other extreme, if the map is set on a single neighbourhood the cells should be as small as buildings, in order to group only very close documents.
So we put together 2 good ideas: a grid-based grouping algorithm, packed as an Elasticsearch plugin.
Enter GeoHash
In the end, we didn’t have to deal directly with calculations on grids because a nice idea called geohash handles it in a concise and elegant way.
A geohash is a way to encode a pair of geographical coordinates as a string, where the encoded value has an interesting property: the more two locations are close to each other, the more chars their respective geohashes have in common. For example, the Dam in Amsterdam (geohash u173zq4xmc) and the Nieuwemarkt, also in Amsterdam (geohash u173zw0m3wes) share the first 5 chars, while two places as distant as the Colosseum (sr2yk3bse2q) and the Liberty Statue (dr5r7p4rn) have no chars in common (shared chars are intended as shared prefixes).
In other words, a geohash prefix (which, by the way, is a valid geohash in itself) identifies a region; the shorter the prefix, the bigger the region.
You can look on http://www.bigdatamodeling.org/2013/01/intuitive-geohash.html for a nice visual exposition of the concept; the article shows cells corresponding to different geohash lengths.
Grouping using this technique boils down to group together documents with identical geohashes to the nth char. The smaller n, the more “aggressive” the grouping, because a short prefix specifies a wide region, which includes more items. On the other end, if you consider the whole geohash length for the matching (elasticsearch uses geohashes of 12 chars) then the only items which end up grouped together are the ones with identical coordinates.
The Plugin
The plugin we made is a facet plugin: this means that the output of the grouping will be available as the result of a facet request, where a single facet instance is one group. The code relies on the geohash calculated by Elasticsearch and available through the GeoPoint#geohash() method. We’ve made this available for your use.
Interested?
If so then first; Download plugin
Use
The project started as a fork of the original geocluster-facet mentioned before. The plugin infrastructure and domain classes are still there, but the base algorithm relies now on the geohashes. So, go and clone the project if you want to know how it works! In the following I’ll go into details of the usage of the plugin.Once you you have installed the plugin: launch a mvn clean package to build the jar, copy it to $ES_HOME/plugins/somefolder/ and restart Elasticsearch.
Let’s assume that the documents in the index contain a field “location” of type geopoint; then an example query to see the plugin in action might be:
curl -XPOST http://localhost:9200/myindex/venues -d ‘{
    "query" : { ... }
    "facets" : {
        "places" : {
            "geohash" : {
                "field" : "location",
                "factor" : 0.9
            }
        }
    }
}’
The factor parameter must have a value in the interval [0, 1], where 0 mean “don’t do any grouping” and 1 corresponds to the most aggressive grouping. The value of factor is translated in the number of geohash chars to consider in the grouping algorithm.
The response would be something like:
{
    ...,

  "facets" : {
	"places" : {
  	"_type" : "geohash",
  	"factor" : 0.9,
  	"clusters" : [ {
    	"total" : 8,
    	"center" : {
      	"lat" : 16.95292075,
      	"lon" : 122.036081375
    	},
    	"top_left" : {
      	"lat" : 33.356026,
      	"lon" : 121.00589
    	},
    	"bottom_right" : {
      	"lat" : 14.60962,
      	"lon" : 129.247421
    	}
  	}, {
    	"total" : 5,
    	"center" : {
      	"lat" : 37.12715661612766,
      	"lon" : -83.15270566
    	},
    	"top_left" : {
      	"lat" : 40.78255308063828,
      	"lon" : -85.50469199999998
    	},
    	"bottom_right" : {
      	"lat" : 36.177174,
      	"lon" : -73.96547029999999
    	}
  	} ]
	}
  }
}
The first element of the “clusters” array is a group made of 8 documents, with its bounding box and center coordinates (the center is calculated as the mean of the coordinates of the documents composing the group).
A map done using the Plugin
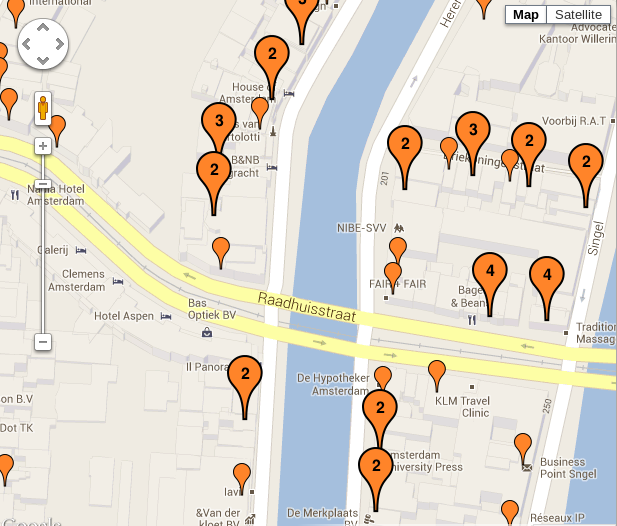
Time again for some map screenshots! Here is the center of Amsterdam and its points of interest:
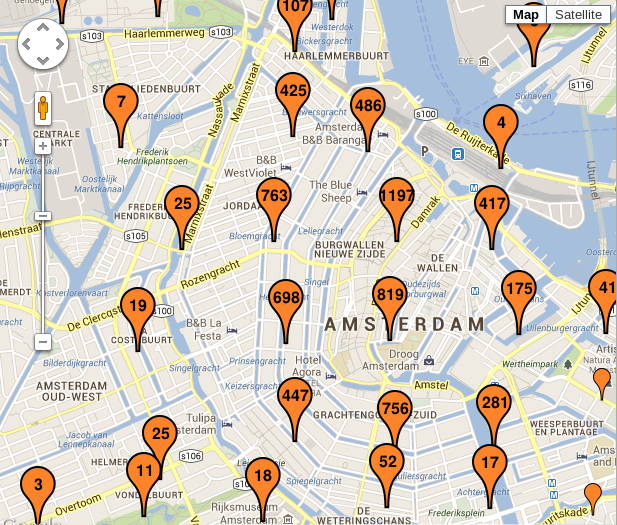
Most of the icons are now groups, collapsing together 2 or more documents (the number of documents is shown inside the icon). You can also see a couple of single documents at the bottom right.
The work of the plugin becomes more visible when we zoom in two levels from the previous view:
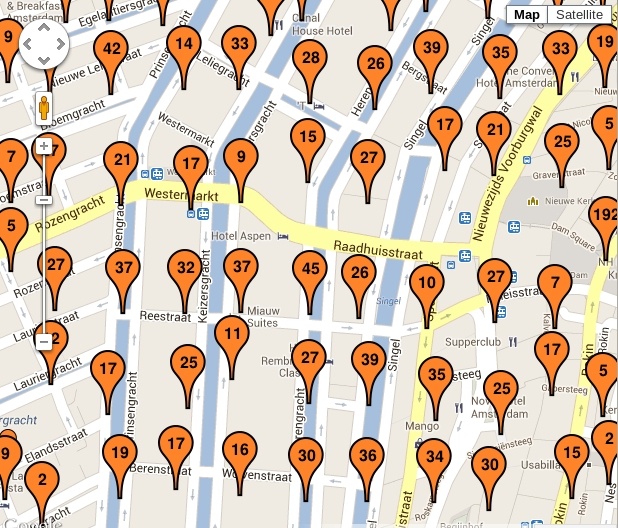
The big groups we had before have bursted in smaller ones, better representing the distribution of the documents in the space. And if we get even closer we start seeing more single documents, each one in its real location:
That’s it, I hope this will help someone else with a use case like ours. I have a couple of closing thoughts about the topic:
- The latest Elasticsearch (0.90.2 as of writing) allows you to do powerful things with geohashes, and I don’t exclude that some future versions might even make this plugin superfluous! Which would make me happy, having one plugin less to install.
- But while this plugin is still needed, I’m thinking about improvements on the fine tuning of the grouping at various zoom levels. A single char of difference in a geohash represents a big change in scale (32x in the area of the cell); going to a sub-character level would probably help finding the most appropriate grouping for a certain map view.