Structured Logging from Azure App Service applications to Datadog
A new year, a new blog! Well, the year isn’t actually new, but I haven’t blogged for a while so it’s about time. If you think that the title of this one is oddly specific then you have a point, although I like to think of it as “highly SEO optimized”.
Another option would’ve been “Yo dawg, we heard you like JSON, so we put some JSON in your JSON so you can log while you log” but not enough people would understand the reference, I’m afraid…
The Situation
For a client we’re deploying Spring Boot web applications to Azure App Service. We’re actually deploying a WAR file to a managed Tomcat, mostly because the applications are still using JSPs. Apart from that, we’re using modern versions of everything and cloud native best practices, including structured logging. In our case, this has been set up with Log4J2’s JSON Template Layout, but there are many ways to enable this and recently Spring Boot even added direct support.
For observability this client has chosen Datadog, which has built-in and deep Azure integration. In the case of Azure App Services, that means that the logs from your Apache HTTP Server, Apache Tomcat and application are automatically sent to Datadog. For application logs that means “everything written to the console”. Sounds easy? Yes, but also too good to be true.
What happens is that every log line written to STDOUT is simply taken as-is and stuffed in a JSON document as a field called “resultDescription”, to which a whole bunch of other fields are added and shipped to Datadog. In Datadog there’s a default logging pipeline for logging coming from the so-called “azure.web” source, and eventually you end up with something like this:
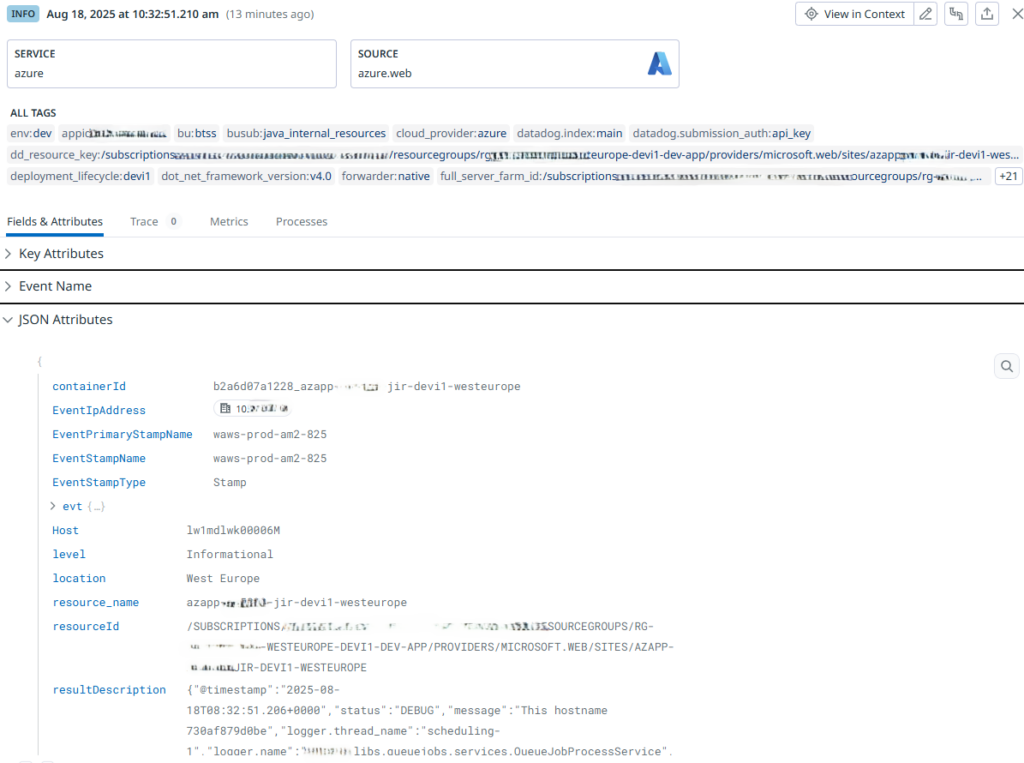
As you can see, we don’t have a log message, the level is wrong and effectively no info is taken from our application logging, because it’s all wrapped up inside the resultDescription field.
Note that the value of that field is a single string with JSON: that’s because the Azure Datadog integration actually escapes the application’s JSON logging, as it doesn’t know (and cannot assume) that the logging uses JSON formatting. If it had included the JSON as-is, then Datadog would have shown nested fields under the resultDescription instead.
The Solution
Typically I’d try to remedy this at the side that’s producing the logs: configure the Datadog agent, set up an observability pipeline. However, in this case we’re leaning on built-in App Service integration and there’s no dedicated agent to configure. Although you can configure a Datadog side car in Azure App Service, I’d prefer to do without that for every individual application (and also am not sure that our pipeline will be able to configure this, or if this is a UI-only feature).
You can also forego the whole Datadog integration and use Agentless logging, but that doesn’t work with Log4J2 (which is what this client is using) and has other issues.
So, in this case I opted for a solution on the Datadog side: we need a custom logging pipeline.
Datadog Logging Pipelines
With Datadog you can set up ingestion pipelines for your logging that teach the tool how to process incoming log statements. For well-known sources, integrations can set up predefined pipelines, but you can also define your own.
As we’re using the built-in Azure integration for our App Service-based applications, there is a default pipeline for logs with an “Azure Web” source. This one isn’t sufficient for our case, though, as it doesn’t know about the custom resultDescription field and its JSON contents.
Defining a custom logging pipeline
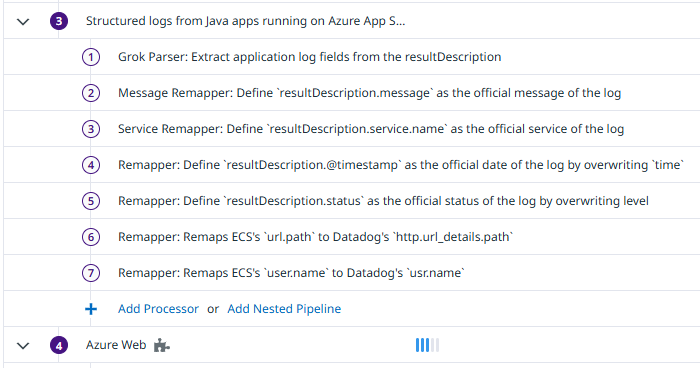
The trick is to define an additional pipeline that runs BEFORE the built-in one for the application logs. This is how I’ve done that:
This is what the definition containing the filter of that new pipeline looks like:
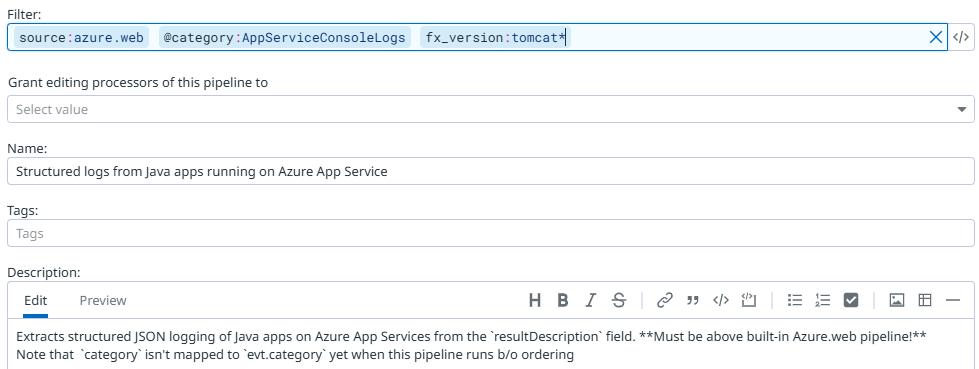
By filtering on category and the fx_version (note the wildcard!) we know that we’re matching console logs and that they come from a Java Tomcat web application (we don’t want to accidentally match applications from other teams here). The Azure App Service integration also sends HTTP server logs and Tomcat logs, and these do not use structured JSON logging and also do not result in a resultDescription field, so we want to ensure we’re matching only our custom application logs that we know to contain JSON.
Processors
The most important goal is to let Datadog parse the JSON in the resultDescription and extract the contents as top-level fields of the log event.
As shown in the screenshot above, the pipeline first contains a Grok processor that does exactly this, and then some processors that handle the resulting fields.
This is the Grok processor:
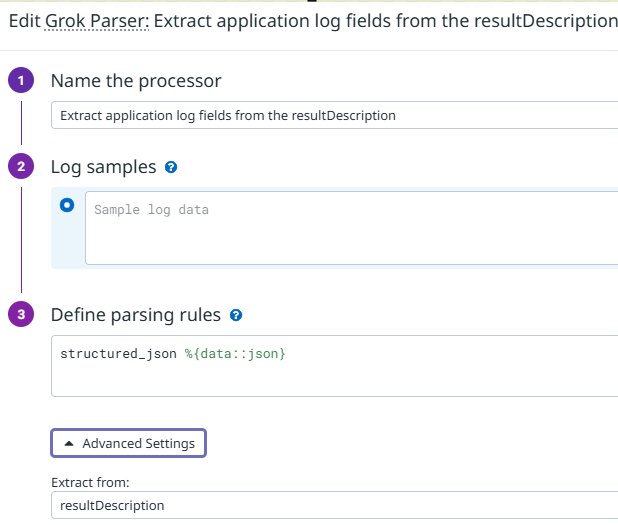
Under the Advanced Settings we configure the field, and then the rule itself becomes trivial. You can read about processing nested JSON here. It’s very nice that we can indicate that the processor should apply to a specific field: I was worried that I’d had to come up with a complex Grok rule that would match the entire JSON message sent by the Azure integration, but as you can see there’s no need for that at all.
The following two processors map message as the message and service.name as the service. The latter is added by our code to every log message to identity the Java service that’s producing the logging.
The next two remap @timestamp to time and status to level without preserving the original attributes: the reason is that the log event already contains those fields (but not with the value that we want) and the built-in azure.web pipeline already defines how to handle those fields. It’s better to reuse them and remove our own fields, that also means there’s less data to store in Datadog.
The final two remap ECS keys produced by a custom filter of our applications to the corresponding Datadog default attribute names (again, without preserving the original fields).
Effect
With this additional pipeline in place, our logging now looks as expected. The logger and thread name are picked up automatically as those fields have the expected names already, and the rest is handled by the pipeline:
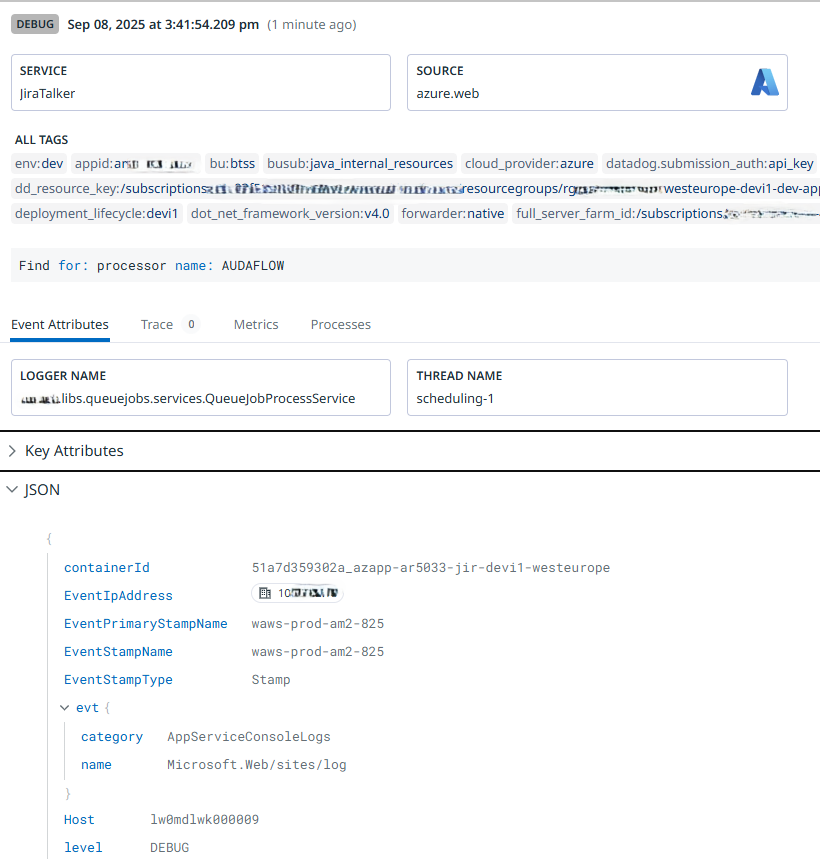
As can be seen, Datadog understands that this is a DEBUG message, the service is now “JiraTalker” rather than “azure” and the logging contains the actual message. There’s no @timestamp nor status field, as they’ve been remapped.
Conclusion
The nice thing about this solution is that it doesn’t require anything on the Azure side: no log files, no side cars, no API keys for Datadog, nothing. Everything is handled at the Datadog side.
The log messages there also still contain the same fields as all other App Services logging, we just change the service name.
We are stuck with the resultDescription field itself, but if its size would become an issue then you could configure Datadog to not index it or you could remap some other small field onto it: it seems like there’s no way to simply drop a field using a logging pipeline processor.