Using logstash, elasticsearch and Kibana to monitor your video card – a tutorial
A few weeks ago my colleague Jettro wrote a blog post about an interesting real-life use case for Kibana: using it to graph meta-data of the photos you took. Given that photography is not a hobby of mine I decided to find a use-case for Kibana using something closer to my heart: gaming.
This Christmas I treated myself to a new computer. The toughest decision I had to make was regarding the video card. In the end I went with a reference AMD R9 290, notoriously known for its noisiness. Because I’m really interested in seeing how the card performs while gaming, I decided to spent some time on my other hobby, programming, in order to come up with a video card monitoring solution based on logstash, elasticsearch & Kibana. Overkill? Probably. Fun? Definitely.
I believe it’s also a very nice introduction on how to set up a fully working setup of logstash – elasticsearch – Kibana. Because of the “Windowsy” nature of gaming, some of the commands listed are the Windows version. The Unix folk should have no problems translating these as everything is kept very simple.
Introduction
AMD launched its new generation of video cards somewhere in the beginning of November. The R9 290 is the second-best card in the AMD lineup and although it received excellent reviews from a performance point of view, most of the reviewers had major complaints about one aspect: the noise the fan makes while gaming. You are probably wondering why I am interested in monitoring my card. Well, other than the obvious benefit of doing something fun with cool technologies, I want to keep an eye on the GPU frequency. AMD utilizes a variable core frequency for the GPU. If it the card gets too hot, the frequency of the GPU will drop allowing it to cool. What I am interested in is during a whole session of gaming, how much time is spent at what frequency. I could then see if the card is throttling the GPU frequency, allowing me to make an informed decision about dropping the fan speed a little while keeping the highest possible frequency and reducing noise. Also other parameters as fan speed, temperature and GPU load are also very interesting to observe. Sure, I could use a Google spreadsheet for this, but where’s the fun in that?
Getting the video card information
Because I want to use logstash, elasticsearch and Kibana and not write software that gathers information from video cards, I’m going to use something that’s already available for obtaining all the specific video card data. TechPowerUp’s GPU-Z works with most if not all video cards out there, shows all available monitoring information for a specific video card and also has the ability to log everything to a text file. Here are the first few lines of the log file for my laptop’s video card. As you can see, it’s a straight-forward CSV file with added whitespace for each column to make it more legible.
Enter logstash
I could have chosen to parse the GPU-Z log file using custom written code, but I really wanted to get my hands dirty with logstash. According to its website, “logstash is a tool for managing events and logs”. Originally created to cure headaches caused by managing hundreds of log files spread across dozens of servers, it’s definitely one of the biggest “hammers” you could find for parsing a single CSV file like the GPU-Z log. But that doesn’t mean it’s not interesting.
Parsing the GPU-Z log file
First step is to download the lastest version of logstash. At the time of writing this was 1.3.2. Second step is to read the CSV file from GPU-Z. At this point, we will not worry about parsing it or possible outputs, we just want to get the information to Logstash. Writing a simple pass-through to Logstash is really easy. The configuration file looks like this:
input {
  file {
    path => [ "D:/it_depends/_kibana/GPU-Z Sensor Log.txt" ]
  }
}
output {
  stdout { }
}
A logstash configuration file has three main elements. An “input” – where to read the data from. A “filter” – this allows a multitude of operations on the input data, including ignoring log messages, modifying the contents of the message or parsing the log message into separate fields. Lastly, the “output” allows the user to send the parsed data to a great variety of outputs, as another file, an elasticsearch server or simply just the logstash console.
As input we tell logstash that we want to keep an eye on a log file by giving the path to that file. Because we’re not yet interested in the output, we just let logstash print everything it receives to the console. Saving the above configuration to a file called “gpuz.conf” and starting logstash with:
java -jar logstash-1.3.2-flatjar.jar agent -f gpuz.conf
will give an output similar to this.
It’s now time to clean up the output. GPU-Z outputs a header line for the CSV which is not particularly useful for monitoring. There are multiple ways of handling this, but the recommended way is to use the “drop” filter together with conditionals. Changing the configuration to:
input {
  file {
    path => [ "D:/it_depends/_kibana/GPU-Z Sensor Log.txt" ]
  }
}
filter {
  if ([message] =~ "\bDate\b") {
    drop { }
  }
}
output {
  stdout { }
}
will ignore all log lines that contain the word “Date”. Although this may seem harsh, all significant log lines generated by GPU-Z contain only numbers, so this is safe to do.
Each log line from the input file is associated with a logstash event. Each logstash event has fields associated with it. By default, “message”, “@timestamp”, “@version”, “host”, “path” are created. The “message” field, referenced in the conditional statement, contains all the original text of the log line.
Next step is to actually parse the CSV file. Fortunately logstash provides a csv filter, which is extremely easy to configure. Restarting the logstash process with the following configuration:
input {
  file {
    path => [ "D:/it_depends/_kibana/GPU-Z Sensor Log.txt" ]
  }
}
filter {
  if ([message] =~ "\bDate\b") {
    drop { }
  } else {
    csv { }
  }
}
output {
  stdout { debug => true }
}
outputs messages similar to this:
{
...
       "column2" => "          135.0   ",
       "column3" => "           405.0   ",
       "column4" => "            42.0   ",
       "column5" => "         255   ",
       "column6" => "       0   ",
...
}
Note that I’ve added the “debug => true” option to the “stdout” output. This configuration prints all fields defined for an event. The csv filter automatically creates a field for each column in the input file but the given field names are non-descriptive. Defining a name for each each column will help later on:
...
filter {
  if ([message] =~ "\bDate\b") {
    drop { }
  } else {
    csv {
	  columns => ["date", "core_clock",
                      "memory_clock", "gpu_temp",
                      "memory_used", "gpu_load",
                      "memory_controller_load",
                      "video_engine_load", "vddc"]
	}
  }
}
...
The only possible issue here is that GPU-Z will only output the data which is exposed by the card. Different cards will expose different parameters – for example my laptop’s video card has no information about the fan speed (most likely because it doesn’t have a dedicated fan), while most high end discrete video cards will output this information. The above configuration will have to be altered based on the information logged by GPU-Z.
The next problem to tackle is the trimming of the field values – the input file contains lots of whitespace that makes the log file easily readable for human eyes, but it’s useless for computers. Logstash has a solution for this as well, called the “mutate” filter, which allows all kind of text operations on the fields of the logstash event. The filter element then becomes:
...
filter {
  if ([message] =~ "\bDate\b") {
    drop { }
  } else {
    csv {
	  columns => ["date", "core_clock",
                      "memory_clock", "gpu_temp",
                      "memory_used", "gpu_load",
                      "memory_controller_load",
                      "video_engine_load", "vddc"]
	}
	mutate {
	  strip => ["date", "core_clock",
                      "memory_clock", "gpu_temp",
                      "memory_used", "gpu_load",
                      "memory_controller_load",
                      "video_engine_load", "vddc"]
	}
  }
}
...
After another logstash restart, a sample of the output looks like this:
...
                "core_clock" => "135.0",
              "memory_clock" => "405.0",
                  "gpu_temp" => "43.0",
               "memory_used" => "260",
                  "gpu_load" => "0",
    "memory_controller_load" => "5",
         "video_engine_load" => "0",
...
And that’s it, the GPU-Z output is parsed, cleansed and ready to be shown in a nice graph! Looking at the final configuration, it’s surprisingly simple and it took very little time to write.
Enter elasticsearch
Printing out data to the console is fine for debugging, but for our exercise we need something a little more persistent. Using elasticsearch as the storage layer for logstash is a natural fit and, as we’ll quickly see, really simple to set up. Naturally, elasticsearch provides a host of features beyond storage and we’ll get to test some of them later on.
Setting up elasticsearch
Running the latest version of elasticsearch couldn’t be simpler. Just download, unzip and run:
bin\elasticsearch.bat
Preparation for the logstash data is also minimal. We simply tell elasticsearch what is the format of the fields we are interested in. The recommended way of doing this is to define a template for the logstash index.
curl -XPUT 'http://localhost:9200/_template/logstash-gpuz' -d '{
    "template": "logstash-gpuz-*",
    "settings": {
        "number_of_shards": 1,
        "number_of_replicas": 0,
        "index.refresh_interval": "5s"
    },
    "mappings": {
        "logs": {
            "properties": {
                "date": {
                    "type": "date",
                    "format": "yyyy-MM-dd HH:mm:ss"

                },
                "core_clock": {
                    "type": "float"
                },
                "memory_clock": {
                    "type": "float"
                },
                "gpu_temp": {
                    "type": "float"
                },
                "memory_used": {
                    "type": "float"
                },
                "gpu_load": {
                    "type": "float"
                },
                "memory_controller_load": {
                    "type": "float"
                },
                "video_engine_load": {
                    "type": "float"
                },
                "vddc": {
                    "type": "float"
                }
            }
        }
    }
}'
Note: cURL is used in the example, which is available for Windows. Any other tool (Sense Chrome plugin, or a simple REST client) is just as suitable.
Note that the fields defined in the elasticsearch template have the same names as the ones defined in the logstash csv filter configuration – this is why it’s handy to have descriptive names coming out of logstash.
Sending data to elasticsearch
We can now configure logstash to send data to elasticsearch. As previously mentioned, logstash supports a large number of outputs, elasticsearch being one of them. Actually two types of elasticsearch outputs are supported: regular and http. The regular version is bound to the latest version of elasticsearch, while the http allows the use of any elasticsearch version (greater than 0.90.5). for this example, I chose the elasticsearch-http output, but the difference in configuration between the two is minimal. The logstash configuration becomes:
input {
  stdin { }
  file {
    path => [ "D:/it_depends/_kibana/GPU-Z Sensor Log.txt" ]
  }
}
filter {
  ...
}
output {
  stdout { debug => true }
  elasticsearch_http {
    host => "localhost"
    index => "logstash-gpuz-%{+YYYY.MM.dd}"
  }
}
The only two things I configured are the host where elasticsearch can be reached and the name of the index that logstash will create to store the data. Generally, for logs, it’s a good idea to create time-based indices, so you can easily delete older ones. Note that the name of the index (e.g. “logstash-gpuz-2014.01.01”) matches the one defined in the template (“logstash-gpuz-*”). Logstash will first apply its own templates, but because the index name matches our custom defined template, it will be picked up automatically and the defined fields will be stored in the desired way. To test the setup, restart logstash and make sure elasticsearch is running. After a few seconds, you will be able to see the log messages in elasticsearch. If you’re running elasticsearch on localhost and the default port you can click this link to see how the data looks like.
Enter Kibana
We now have the data in elasticsearch, but looking at JSON documents is not terribly exciting. Kibana is an excellent tool to visualize your data. It has a very nice interface to build graphs, charts and much, much more based on data stored in an elasticsearch index.
Setting up Kibana
Written mostly in Javascript, the Kibana distribution needs to be deployed inside a HTTP web server that can serve the files. Anything will do, including Apache httpd, Tomcat or Jetty. Although not the advertised way of doing this, I often end up copying the contents of the Kibana folder inside my elasticsearch installation, creating the directory structure as needed:
path/to/elasticsearch/plugins/kibana/_site
After a restart, elasticsearch will pick this up as a site plugin and serve the files just fine. To access it point your browser to http://localhost:9200/_plugin/kibana.
Regardless of where you installed Kibana, if you’re running both elasticsearch & Kibana on the same host, you’re good to go. For a production setup it is recommended to point Kibana to the elasticsearch host using the fully qualified domain name of the host. Accessing your Kibana installation, you should see a page similar to this:
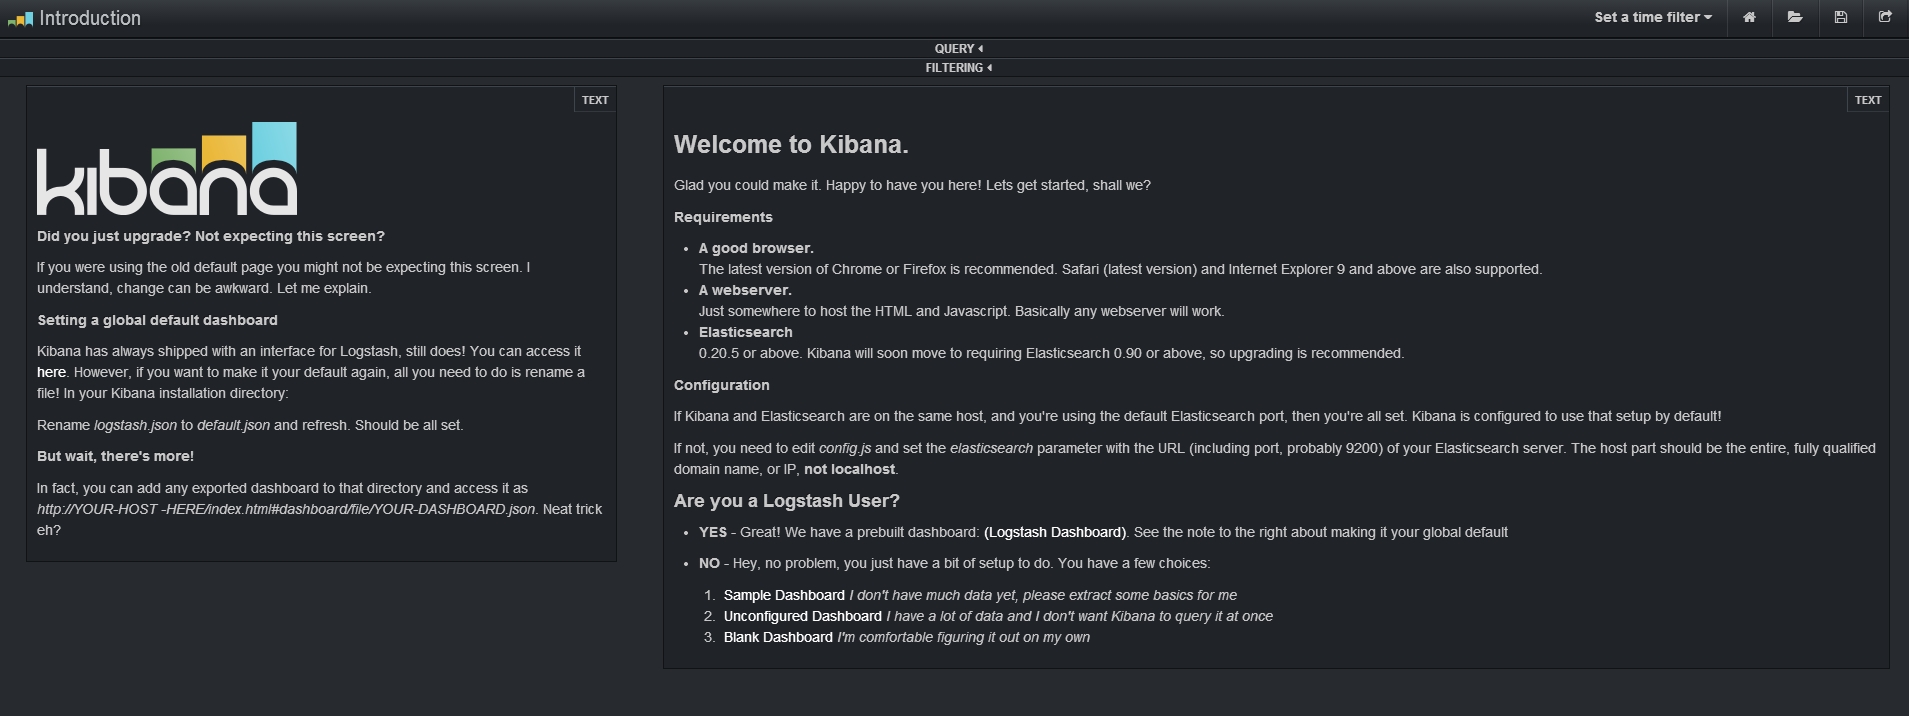
The last piece of the puzzle is to configure a Kibana dashboard to display our GPU-Z data. Start with an empty dashboard by clicking the “Blank Dashboard” link from the Kibana welcome page. Clicking on the sprocket icon in the top right corner you can now configure your dashboard:
- On the “General” tab give your dashboard a name you can easily recognize.

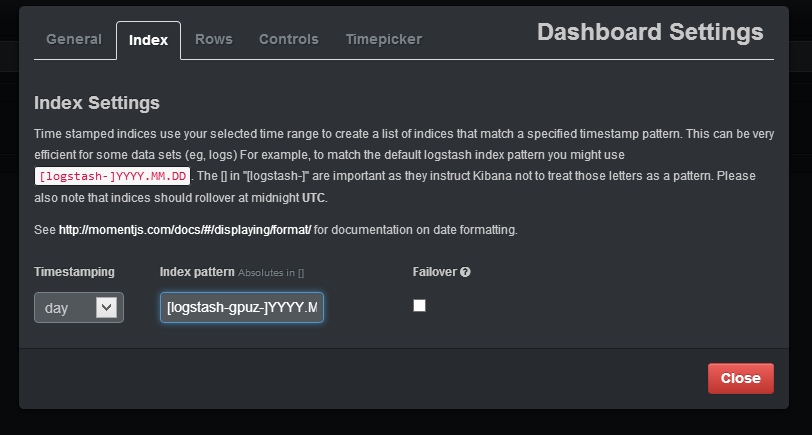
2. On the “Index” tab point Kibana to the elasticsearch index where the GPU-Z data is stored. The index name I chose in the logstash configuration is “[logstash-gpuz-]YYYY.MM.DD”. Also “day” timestamping should be selected (as a new index will be created every day by logstash).
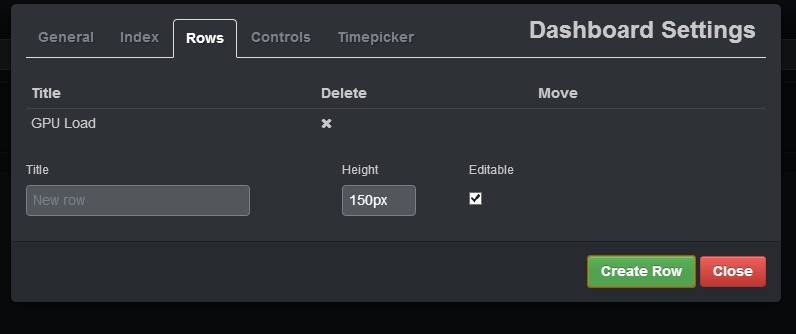
- On the “Rows” tab add a row with the name “GPU Load”
4. On the “Timepicker” tab type “date” inside “Time Field”. This is the name of the field that we configured inside the logstash csv filter as well as the elasticsearch mapping. It holds the date & time at which GPU-Z generated the log message.

- Click close.
We have an empty dashboard to which we can add as many panels as we need. Clicking on the “Add panel to empty row button” will open the following dialog:
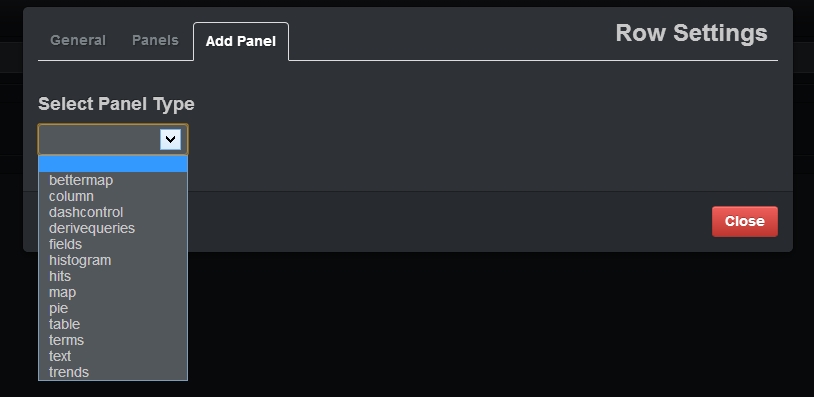
Chose the “histogram” type and select the following options:
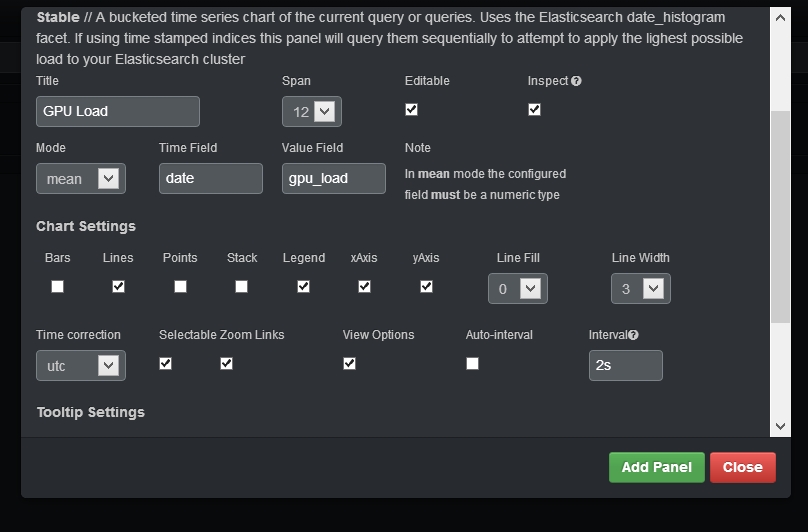
- For “Title” type in “GPU Load” or any other name of your choosing
- For “Mode” choose mean
- For Time Field choose date
- For Value Field choose gpu_load
- For Chart Settings select only “Lines”, “xAxis” and “yAxis”
- For Time correction select utc
- Deselect “Auto-interval”
- For Interval type in “2s”
After clicking “Close” you should see something similar to this:
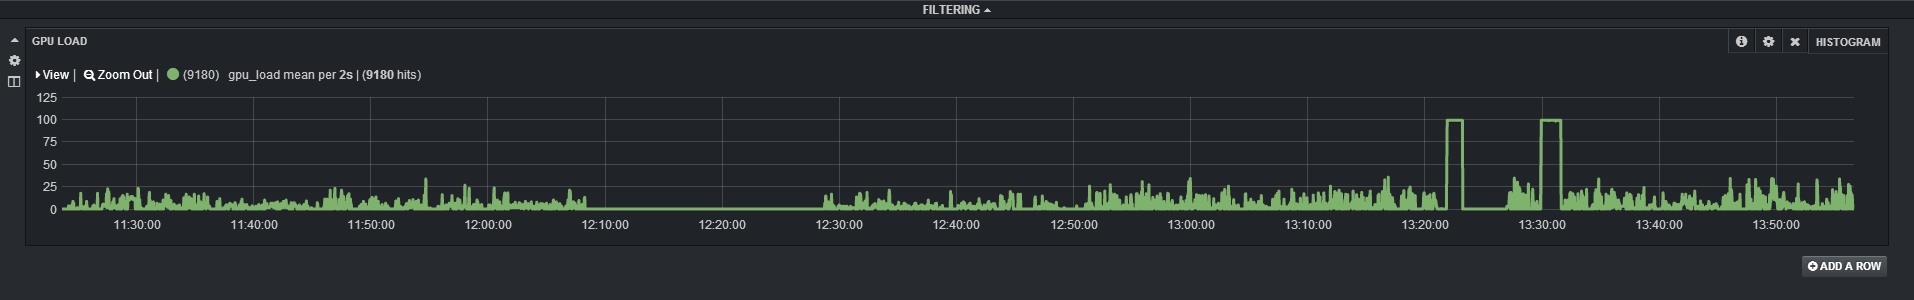
And we’re done! We now have a fully working setup of logstash, elasticsearch and Kibana. We can add as many rows or panels as we need, plotting the different information that GPU-Z (e.g. gpu_temp, core_clock etc.). Kibana is fully interactive, allowing you to select & zoom a particular area in the graph or to select a time filter from the top bar. Play around with the different options, try adding different graphs and charts, see what effect selecting different intervals has. When you’re satisfied with the dashboard, don’t forget to save it by using the save icon from the top bar.
Where to go from here?
This was a pretty long blog post and if you’ve made it so far, you now have the basic knowledge to start using logstash in combination with elasticsearch and Kibana. But it was also a very condensed post, full of new information for somebody with little previous experience with the tools used.
If you want to learn more about Logstash, it has excellent documentation, I suggest you start from there. The videos listed on the Logstash home page are also really good.
Elasticsearch is a very powerful search engine and its capabilities can be barely touched upon in a blog post. The best introductory resource I’m aware of is this video of Simon Willnauer’s “With a hammer in your hand” talk at NoSQL matters Cologne 2013 conference.
The best resource I know for Kibana is the Kibana demo. You can see all the different graph & chart possibilities Kibana offers, create new ones, play around with filters – the possibilities are endless. I’ve already mentioned Jettro’s post in the beginning, but it deserves another mention here – you can learn a lot about Kibana by reading it. In the end, I believe learning by doing is the best way to teach yourself about what Kibana has to offer.