Spring Boot Observability: Database Interactions
Watch That Booty!
For Nederlandse Loterij, we develop a subscription system that manages subscriptions for various lottery brands, creates invoices, handles the payments and eventually provisions the tickets.
The system consists of ca. 10 different services, which all connect to a database, which in our case is a managed PostgreSQL running on AWS. This database makes a lot of metrics available out of the box.
Who Are You? (who who, who who)
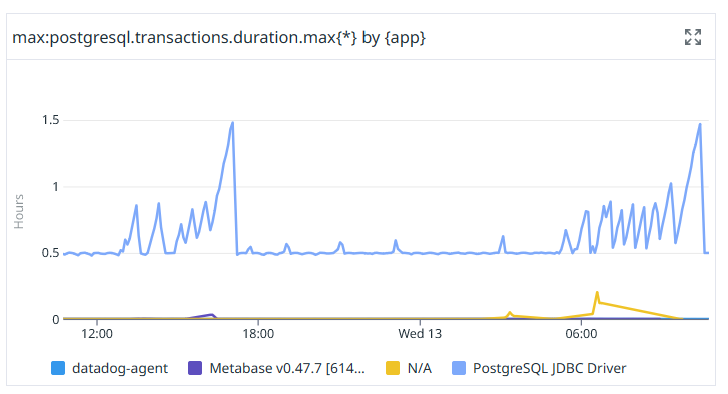
When you start to drill down into some of these metrics, you’ll notice that metrics like postgresql.queries.duration and postgresql.transactions.duration contain a tag named “app”, which represents the application connecting to the DB. However, by default for the Boot apps this is set to “PostgreSQL JDBC Driver”:
We have around 10 different services. One contains Batch jobs, others are handling OLTP concerns like creating a new subscription, or create business reports. We don’t really want to see those lumped together as one app in the DB metrics.
Fortunately it’s easy to change this: you can simply configure the database connection to use the application’s service name instead. This is how we do that in YML:
spring:
 datasource:
   hikari:
     data-source-properties:
       # see https://jdbc.postgresql.org/documentation/use/#connection-parameters
       ApplicationName: ${spring.application.name}
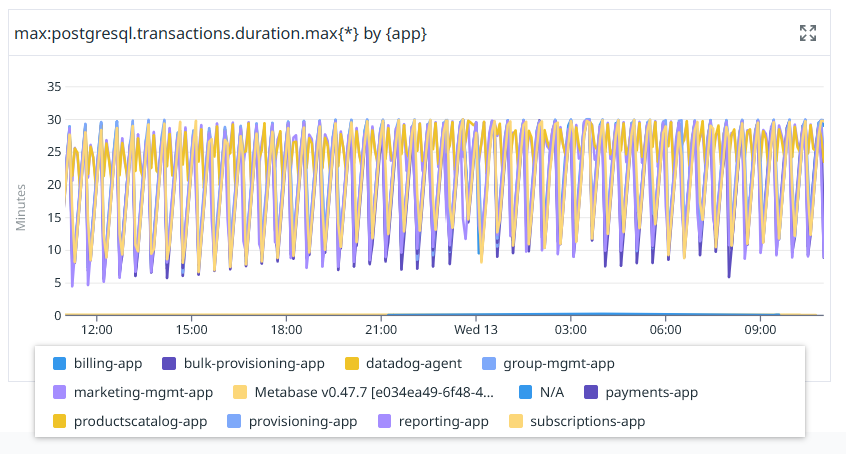
With that simple change, it suddenly becomes possible to distinguish between the apps in the PostgreSQL metrics:
These names are the same values that our application metrics use for a “service” tag that we add. This is done by using a Micrometer meter registry customizer:
@Bean
MeterRegistryCustomizer<MeterRegistry> commonTags(Environment env) {
   String serviceName = env.getProperty("spring.application.name", "unknown-service");
   String hostName = Objects.requireNonNullElse(System.getenv("HOSTNAME"), "localhost");
   return registry -> registry.config().commonTags(
       "service", serviceName,
       "instance", hostName
   );
}
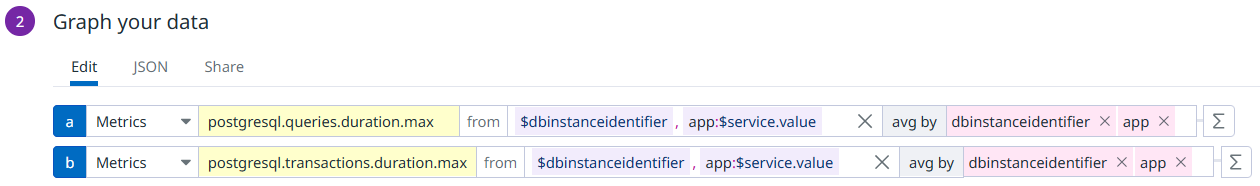
That means that we can now create a database calls-related dashboard with template variables to allow all widgets to filter on the selected service. In that dashboard we also include built-in metrics from the Hikari connection pool and the Spring Data JPA repositories. Note how this allows to see what info displayed in the widgets correlates to the same service, and how we can filter (best watched full-screen):
Note: since our default tag is “service” but the DB metrics use “app” instead, you can use a syntax in Datadog where you refer only to the selected template variable’s value, rather than the name:value combo:
Application-level Metrics
As shown in the video, our dashboard contains metrics from our Spring Data repositories and the Hikari connection pool. Let’s discuss these in some detail.
Spring Data has a metric called spring.data.repository.invocations. When you export this to Datadog, it derives a min, avg, max and count for that. These metrics provide “repository” and “method” tags that can be used to filter on the code executing the queries.
With this and the service tag that we add, it becomes trivial to show the average query execution time per service and the top 10 of slowest query methods:
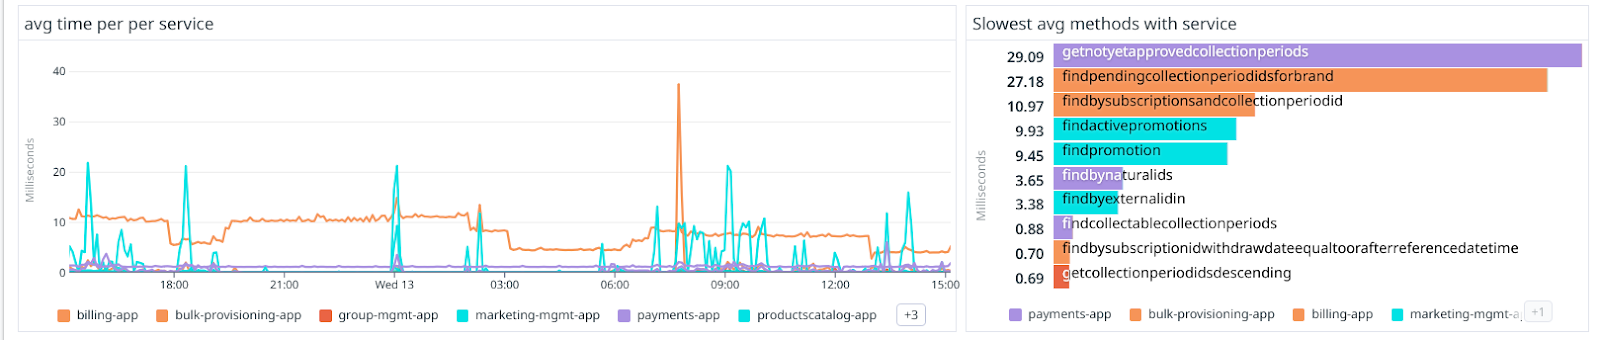
By ensuring that the top list groups by method 1st but by service 2nd, you can hover over these methods and see the associated service, which then also gets highlighted in all the other graphs automatically.
Because the dashboard has the service as a template variable, filtering everything to show only the metrics for one particular service now becomes trivial as well.
The Hikari metrics are also extremely useful. Not only can you see things like the actual number of connections in use, but you can also track how long connections are in use and what the wait time is for an available connection in case of contention.
Here we see an example where it clearly shows that our marketing app has some really long-running queries, but these do not consume all the available pooled connections so the wait time remains low:
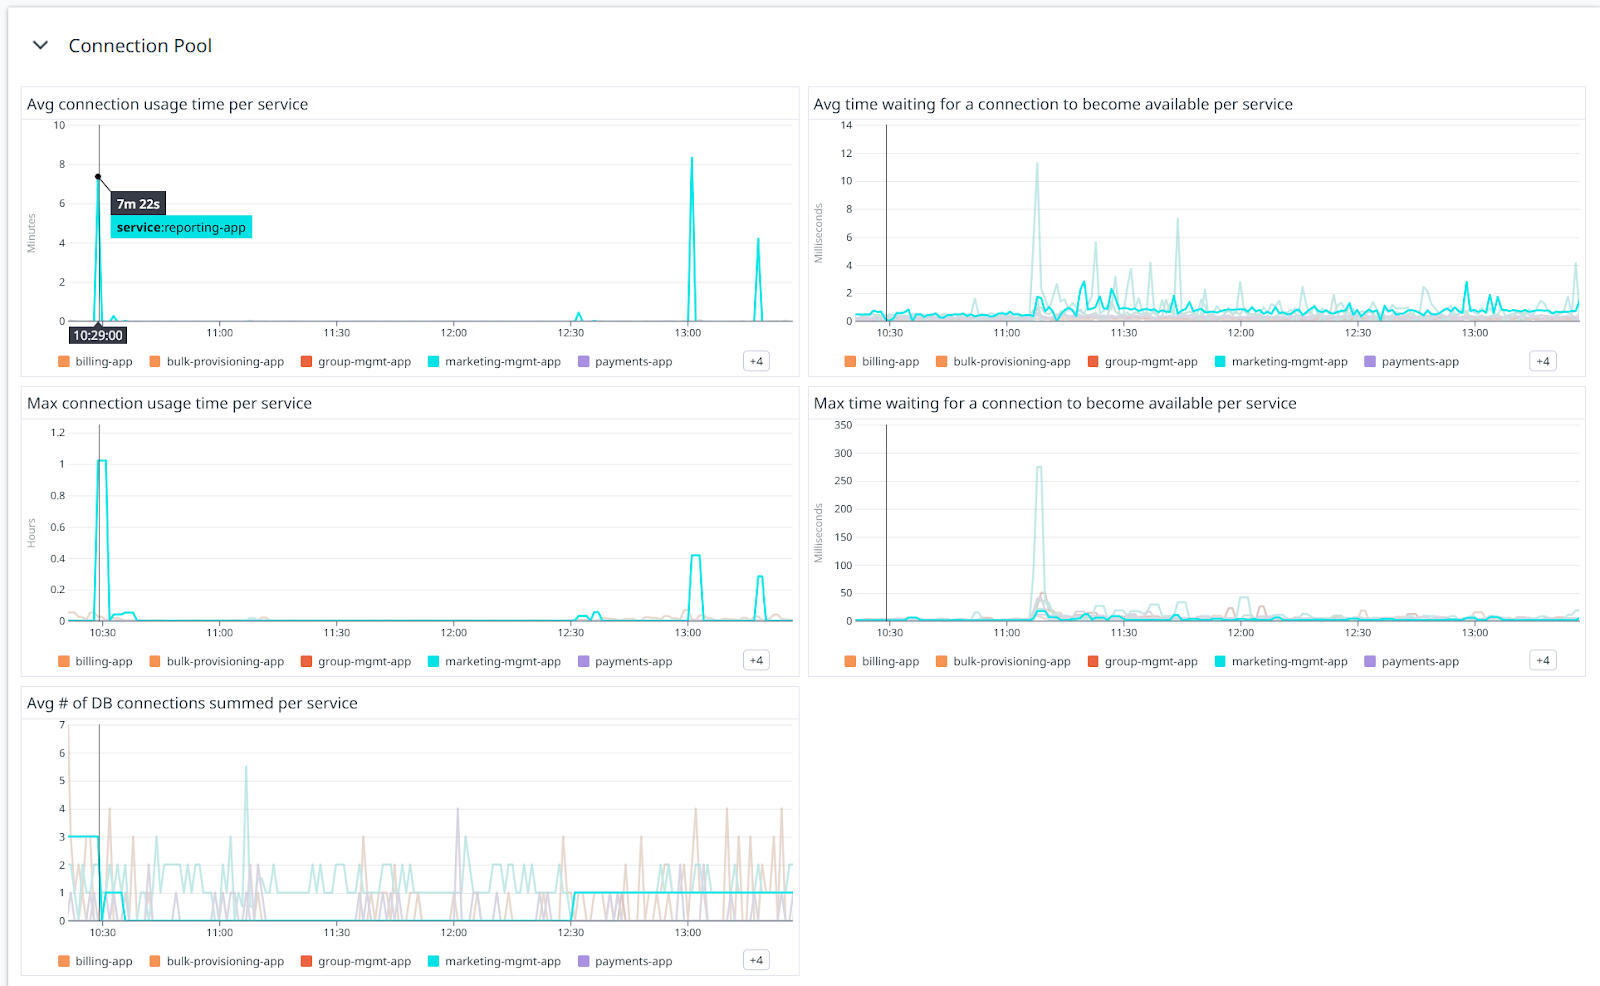
Having insight into these sorts of metrics is super-valuable, esp. since it’s so easy to combine information from your repositories, connection pool and database together for correlation.
In the next blog, I will show how we can use metrics as well as logging to improve the observability of Spring Batch jobs.