Spring Boot Observability: Spring Batch Jobs
Watching paint dry
In my previous blog post I described how we provide insight into our database interactions inside Datadog for the subscription system that we develop for Nederlandse Loterij.
Processes executed by this system are often batch-oriented, which is why the system contains a dedicated service that uses the Spring Batch framework to execute these long-running jobs.
Of course it then becomes important to be able to observe these executions: how long do the jobs take to run, are there failures, what logging is associated with these jobs, etc.
Spring Boot and Batch provide some metrics out of the box, but to really make the most effective use of the frameworks you need some tuning and some understanding of the components involved. In this post I want to showcase some things that we’ve done to optimize the observability of our Spring Batch jobs.
We are using Datadog, but these tips apply to other observability tools as well, esp. those that combine metrics with logging.
First things first: ensuring consistent tag names
Spring Batch provides metrics for components at different levels: jobs, steps, chunks and items. With version 4 of the frameworks, the tags used in these different metrics to identify things like job names are unfortunately not consistent. Metrics for jobs have a “name” tag, but the step- and chunk-related metrics refer to a “job.name”.
This makes it harder to build a dashboard where you can easily filter by job name using a template variable.
Batch 4 vs Batch 5
Our team is still busy to complete the migration to Boot 3 and Batch 5. One of the reasons that this is far from trivial for us is that we’re using a 3rd-party add-on called Lightmin, which provides a nice Web UI for inspecting jobs and executions and also allows you to schedule these executions while storing the schedule in your database: functionality that’s lacking in Spring Batch itself.
However, Lightmin isn’t actively maintained anymore, and Batch 5 contains a ton of breaking changes. That means we have to effectively create a private fork and update everything ourselves.
In the process of doing this I discovered that Batch 5 also changed its metric tag names: for jobs it now uses “spring.batch.job.name”, while in steps it uses “spring.batch.step.job.name” to identify the job. The tag name for names of steps changed as well. So these tags are still inconsistent, but now in a different way 🥹
It also seems that the documentation hasn’t been updated to reflect these changes yet.
Taking Control
To ensure that our metrics tags are consistent today with Batch 4 and will stay consistent when we update to Batch 5, I wrote some Micrometer meter filters:
/**
* @see org.springframework.batch.core.observability.BatchJobObservation.JobLowCardinalityTags#JOB_NAME
*/
@Bean
MeterFilter jobJobNameTagRenamingMeterFilter() {
   String prefix = "spring.batch.job";
   boolean batchV5 = ClassUtils.isPresent("org.springframework.batch.core.observability.BatchJobObservation", null);
   String from = batchV5 ? prefix + ".name" : "name";
   return MeterFilter.renameTag(prefix, from, "job.name");
}


/**
* @see org.springframework.batch.core.observability.BatchStepObservation.StepLowCardinalityTags#JOB_NAME
*/
@Bean @ConditionalOnClass(name = "org.springframework.batch.core.observability.BatchStepObservation")
MeterFilter stepJobNameTagRenamingMeterFilter() {
   String prefix = "spring.batch.step";
   return MeterFilter.renameTag(prefix, prefix + ".job.name", "job.name");
}


/**
* @see org.springframework.batch.core.observability.BatchStepObservation.StepLowCardinalityTags#STEP_NAME
*/
@Bean
MeterFilter stepStepNameTagRenamingMeterFilter() {
   String prefix = "spring.batch.step";
   boolean batchV5 = ClassUtils.isPresent("org.springframework.batch.core.observability.BatchStepObservation", null);
   String from = batchV5 ? prefix + ".name" : "name";
   return MeterFilter.renameTag(prefix, from, "step.name");
}
This will cause some sane and consistent naming across the various batch metrics that we care about.
Correlating Metrics and Logging
The real power of observability comes from being able to combine various types of information: metrics, logging and traces. With the above changes, it becomes very easy to create a dashboard that shows various graphs based on batch metrics which can all be filtered by job. It would be really nice if we could include log messages in that same dashboard that would also respect the overall filtering on a job name.
To make that work, we need two things.
Include the job name in log message attributes
First of all, we obviously need to add the job name to all log messages that are produced in the context of a job execution. This is easiest to do by adding an MDC attribute using your own JobLauncher. You can see how to do just that in one of our old blogs.
While working on this system, I basically copied the code from my own blog and patted myself on the back. This is what it looks like:
/**
 * Ensures that logging performed in the context of a batch job includes a {@code job.name} MDC entry.
 */
public class SubscriptionJobLauncher extends SimpleJobLauncher {

    private static final String MDC_KEY = "job.name";

    @Override
    public JobExecution run(Job job, JobParameters jobParameters) throws JobExecutionAlreadyRunningException, JobRestartException, JobInstanceAlreadyCompleteException, JobParametersInvalidException {
        try (var c = MDC.putCloseable(MDC_KEY, job.getName())) {
            return super.run(job, jobParameters);
        }
    }

    @Override
    public void setTaskExecutor(TaskExecutor taskExecutor) {
        super.setTaskExecutor(new MDCPopulatingTaskExecutor(taskExecutor));
    }

    private static class MDCPopulatingTaskExecutor implements TaskExecutor {
        private final TaskExecutor targetExecutor;

        MDCPopulatingTaskExecutor(TaskExecutor targetExecutor) {
            this.targetExecutor = targetExecutor;
        }

        @Override
        public void execute(Runnable task) {
            String mdcValue = MDC.get(MDC_KEY);
            if (mdcValue == null || targetExecutor instanceof SyncTaskExecutor) {
                targetExecutor.execute(task);
            } else {
                targetExecutor.execute(() -> {
                    try (var c = MDC.putCloseable(MDC_KEY, mdcValue)) {
                        task.run();
                    }
                });
            }
        }
    }
}
However, when I tested it I didn’t see anything…
Ensure Lightmin uses our own JobLauncher
As it turns out, our system simply ignores the job launcher that you can configure if you override the createJobLauncher from a batch configurer parent class because Lightmin has its own configuration for creating launchers.
You can override that by defining two beans yourself, a scheduler configuration and a listener configuration. Here’s the code for the scheduler, the listener version is basically the same:
@Component
public class SubscriptionSchedulerService extends DefaultSchedulerService {
    public SubscriptionSchedulerService(BeanRegistrar beanRegistrar, JobRepository jobRepository, JobRegistry jobRegistry) {
        super(beanRegistrar, jobRepository, jobRegistry);
    }

    @Override
    public JobLauncher createLobLauncher(TaskExecutorType taskExecutorType, JobRepository jobRepository) {
        return SubscriptionJobLauncher.forLightmin(taskExecutorType, jobRepository);
    }
}
I added a static method to our custom job launcher that we’re calling in the above code:
/**
  * @see org.tuxdevelop.spring.batch.lightmin.service.ServiceUtil#createJobLauncher(TaskExecutorType, JobRepository)
*/
static SubscriptionJobLauncher forLightmin(TaskExecutorType taskExecutorType, JobRepository jobRepository) {
    var jobLauncher = new SubscriptionJobLauncher();
    jobLauncher.setJobRepository(jobRepository);
    if (taskExecutorType == TaskExecutorType.ASYNCHRONOUS) {
        jobLauncher.setTaskExecutor(new SimpleAsyncTaskExecutor());
    } else if (taskExecutorType == TaskExecutorType.SYNCHRONOUS) {
        jobLauncher.setTaskExecutor(new SyncTaskExecutor());
    }
    return jobLauncher;
}
Ensuring consistent tag name values: are we there yet?
As I already mentioned, we actually need to do two things to be able to allow our dashboard filtering to apply to logging as well.
We just covered the first: job names will now end up in our MDC using a “job.name” key. We use structured JSON logging that adds all MDC entries to our log message JSON document, and the Datadog agent will forward that to the server where these entries will show up as attributes.
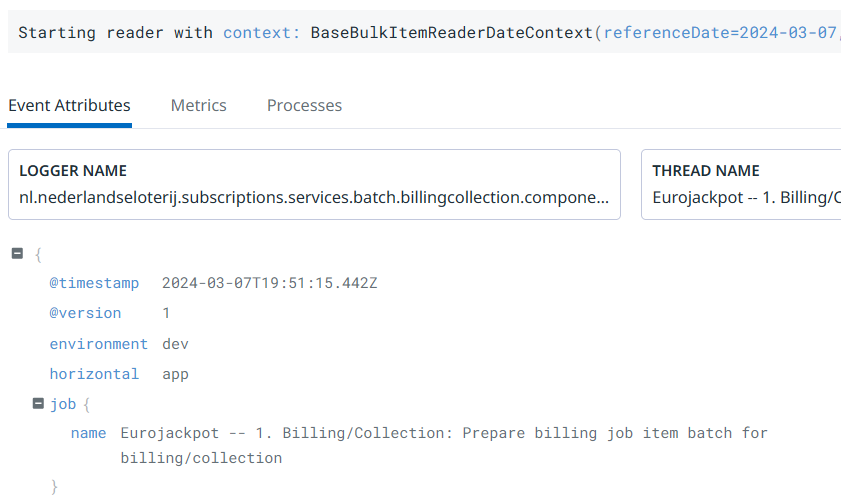
However, the value that’s shown is different from the values that are used for our metrics. This is what shows up there:
As it turns out, Datadog only supports certain characters to be used in a tag value and replaces the rest with underscores. It also lowercases everything.
Since we want consistency, I wrote a function that will rewrite the job names we put in the MDC to match Datadog’s behavior:
static final Pattern ILLEGAL_CHARS = Pattern.compile("[^A-Za-z0-9_:./-]");

/**
* Rewrites the given value in the same way that the value would end up as a Datadog metric tag value,
* meaning it's lower-cased and non-allowed characters are converted to underscores.
*
* @param value to convert, may be {@code null}
* @return converted value
* @see <a href="https://docs.datadoghq.com/getting_started/tagging/#define-tags">Datadog tag docs</a>
*/
public static String asDatadogTag(String value) {
   if (value == null) return null;
   return ILLEGAL_CHARS.matcher(value.toLowerCase()).replaceAll("_");
}
Now we simply call that when adding the job name to the MDC and everything starts working exactly like we want it to.
Building the Datadog dashboard
We’re ready to create our dashboard!
Right now we show what jobs failed and some info about their execution times. We also do that for steps and then include some info on chunks, although I’m not sure yet how useful the latter will turn out to be.
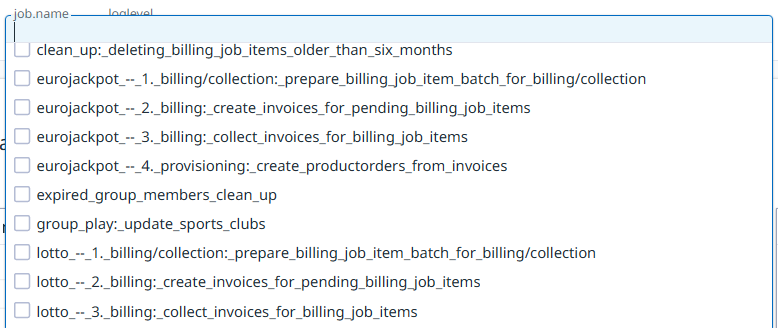
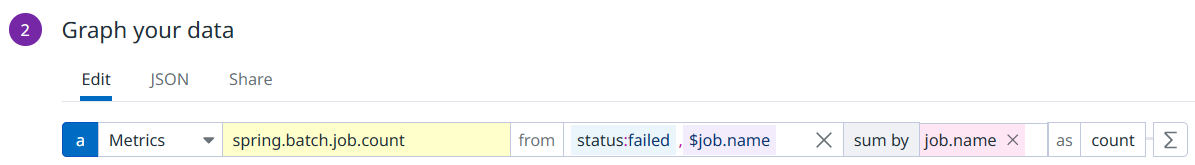
As shown, we can see metrics for all jobs, and filter by job name consistently. In Datadog you do this by adding a template variable, which automatically get populated with possible values if it matches an existing metrics tag. In our case that’s our job.name, of course. In the widget’s definition you then filter by that variable:
For our logging this needs to be a bit different, though: when you simply add $job.name, it inserts a criteria like “job.name:my_awesome_job”. However, for the logging we need to filter on an attribute, which requires the criteria to look like “@job.name:my_awesome_job”, so with a leading at-sign.
Fortunately this is easy to achieve: we simply prefix the criteria. The logging will then only show matching messages. However, not all log messages from our batch service have a job.name attribute, simply because not all logging is performed in the context of a job execution. I want to make sure that we see those messages as well.
This is the solution I’m using to show the correct logs:
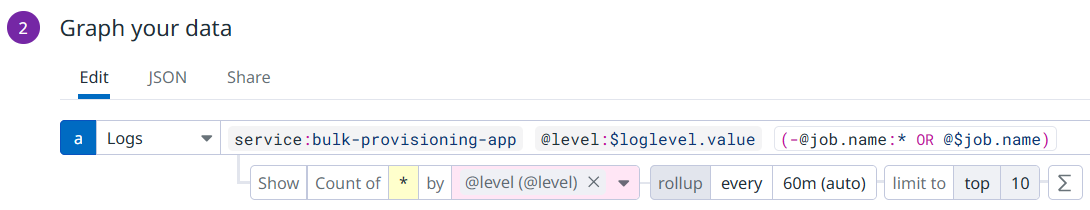
This selects log messages from the relevant service that have no job.name attribute OR have a matching one.
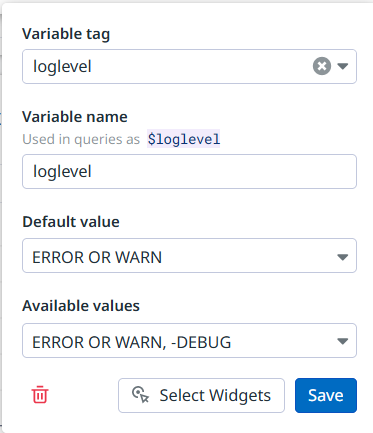
As you can see, I’ve also introduced an additional template variable that selects messages based on log level, where I’m only referencing the variable’s value (instead of a key:value pair). That one is not populated based on existing values, but uses a hardcoded set of options instead:
With this we’re pretty much done. There’s just one catch: everything I’ve shown work perfectly if you select a job name to filter on. However, when you use the default selection of “*” for the job.name variable, you’ll see that only log messages without a job.name attribute are now shown. Why?
Teaching an old Datadog new tricks
I investigated, and it turns out that when Datadog sees that your variable uses * as its value it simply drops the “ OR @$job.name” from our logging query. That results in the query using (-@job.name) instead of (-@job.name OR @job.name:*) like we want to.
I’ve opened up a case for this with Datadog, but for now a simple workaround is to use a default value that has an actual character in there that will still match all possible values. In our case *_* work well for this:
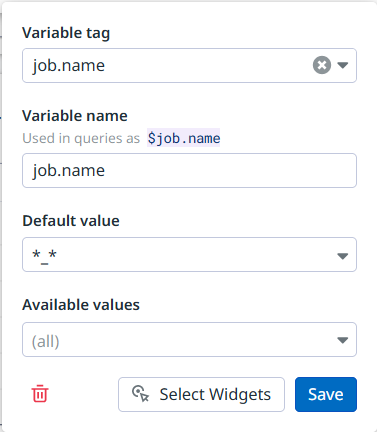
With that final hack in place, by default all metrics and logging are shown, and are consistently filtered by job name when a selection is made in the dashboard.
A typical workflow would now be to look at the dashboard, notice some failures or unexpected slowness of a job, filter on it, look at the warnings and errors in the log and if those aren’t sufficient, change the log level to see the INFO messages as well to understand what’s happening exactly.
Batch Observability Nirvana!
Conclusion
Observability for batch applications is as critically important as it is for other types of applications. Fortunately a framework like Spring Batch provides a lot of metrics out of the box already. For use in efficient dashboarding it requires some tweaking to make things more consistent, though.
If you then ensure that your logging follows the same conventions, it becomes easy to create very powerful dashboard that allow you to quickly zoom in on specific jobs and see relevant error rates, timings, and log messages all together for quick analysis and trouble shooting.
I hope this blog post helps you to come up with ways to improve the observability of your own batch applications! If you’d like Trifork to help you with that, don’t hesitate to contact us.